
There are numerous ways for traders to identify possible price objectives.
Fundamentally minded traders might use one of many valuation methods like the Dividend Discount Model, Discounted Cash Flow or Comparable Company Analysis to establish price targets, while technical traders depend on price action to provide them with volatility and pattern-based targets (my personal preference).
While there is an entire industry built around using fundamental valuation methods to identify price objectives, fundamentally-based forecasting is poorly suited for trying to time price moves.
I’m about to show you one technical method that not only offers an edge in setting time-based expectations but also allows for incremental targeting.
The Measured Move
Chinese electric vehicle maker NIO was one of many companies that surged out of the gates this past week.
After a brief period of healthy consolidation that took place from 06/18 to 06/27, NIO broke to 4-month highs on Monday.
If a trader happened to see Monday’s breakout in real time, how might he or she have gone about establishing a potential price target?
One extremely popular method would be to apply “measured move” targeting.
Far too often, novice traders will set target expectations based on the next level of support or resistance.
For example, after a breakout they simply look to see where the next big level is and use that as their target.
While the next big level may provide tradable support or resistance at some point in the future, that’s not the right way to measure for targets.
Instead, price action is often dictated by mathematical relationships, where cycles develop in relation to each other.
A “measured move” targeting system is a simple way to monitor how cycles develop.
“Measured moves” develop in the following stages:
1. A trend reversal.
2. A post-reversal price advance (i.e., a rally).
3. A consolidation period.
4. A continuation advance.
Let’s break this process down using the chart of NIO.
Figure 1
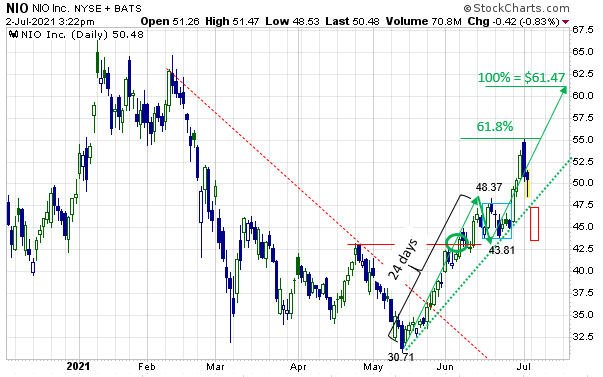
In the case of NIO, the chart directly above shows that the stock price staged a trend reversal of its February through May downtrend during late May/early June trading (see green circle).
Next, NIO continued to build on the late May/early June trend reversal with a further price advance that lasted through to the mid-June pivot high of $48.37.
This was then followed by a brief consolidation period through late June (see blue box), which finally produced a continuation advance this week.
The textbook target that can now be derived by using the “measured move” methodology is a 100% extension of the 05/14 to 06/18 rally projected from the 06/22 low as the green arrows on the chart above depict.
Let’s look at the math behind this.
If we subtract the 05/13 pivot low price of $30.71 from the 06/18 pivot high price of $48.37, we get $17.66.
If we then add that to the 06/22 pivot low price of $43.81 we get a target of $61.47.
That $61.47 target is depicted by the 100% marker on the chart above.
Remember, this target only represents the measured POTENTIAL over the days to weeks ahead.
Now, remember earlier I mentioned that this method of targeting also helps traders manage time expectations and ser incremental price objectives?
Well, the 61.8% marker on the chart above represents the incremental price target ahead of a possible 100% move, which is exactly where this week’s highs developed.
The 61.8% level is part of the Fibonacci extension sequence (23.6%, 38.2%, 50%, 61.8%…).
In terms of setting time expectations, a trader can generally expect the continuation advance phase of the measured move process to take roughly the same amount of time to develop as the trend reversal and price advance phases.
In this case, it took the trend reversal and price advance phases 24 trading days to develop, which means that, if this measured move does in fact reach its 100%, it should take roughly 24 trading days to from the 06/22 pivot low of $43.81 to reach the 100% target.
Bottom Line
If a trader happened to buy NIO’s early-week break above the late June consolidation, he or she can allow those profits to run until the post-05/13 uptrend (see dotted green line) starts to show signs of breaking down.
If, however, a prospective buyer of NIO is looking to enter a long position for the first time in anticipation of an eventual rally to the POTENTIAL longer-term target area of $61.47, he or she should be using the current pullback as an opportunity to build a position, using the area between the prevailing trend line and the late June pivot low as a stop out zone (see red box).


