I said it before and I’ll say it again, I don’t know of any other services that are as interactive and responsive to members as Raging Bull.
Today, I am going to take another step in proving that to you by sharing the steps to add one of my most important trading tools to your charts…
AND, I am going to show you how this tool that kept me from owning NFLX prior to this week’s 30% collapse, unlike a certain CNBC talking head.
This Technical Analysis Tool Was Still in a Sell Signal Ahead of This Week’s NFLX Collapse
Perhaps the one thing I love most about what I do is not only being able to communicate with my members via the interactive comments section of every article Raging Bull produces, but also educating my members on everything trading.
That said, I am about to “kill two birds with one stone,” by responding to this recent member inquiry using the chart of NFLX as my canvas.
Why NFLX, you ask?
Because it is a perfect example of how a system like mine would have kept you away from that disaster this week.
So, the member recently wrote to me saying…

Now, before we talk about how my Keltner band system kept me from buying oversold NFLX shares recently, let’s look at a quick backstory:
If you were to do a little research on Jim Cramer, you would find that he ran a hedge fund from 1987 to 2000.
You would find claims that he had only one year of negative returns during this stretch.
However, you’ll also find that some claims are disputed.
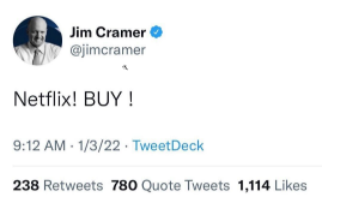
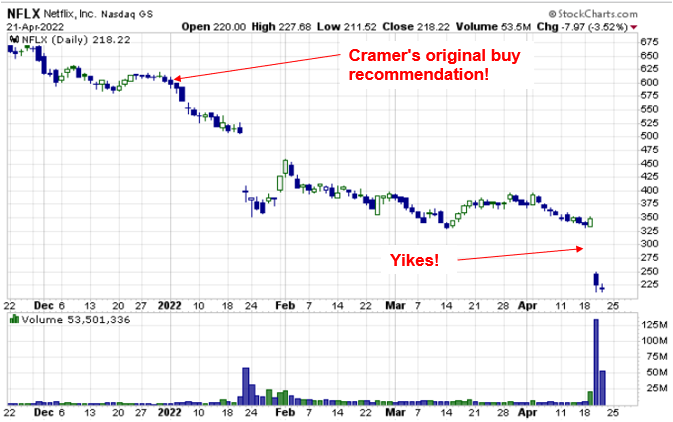
2000 was a long time ago, and his 01/3/22 BUY recommendation of NFLX is yet another example of how surprising it is he’s been so popular for so long.

Unless you were in Mexico sipping margaritas all week, you probably saw that NFLX collapsed 30% overnight on Wednesday, after it had already been in a straight line down year-to-date.

Now, I know you might be tempted to want to buy oversold stocks, because of the quick upside reversals that can sometimes follow.
But, you have to be disciplined when taking bets against the trend, and by disciplined I want you to see exactly what system I follow, without expectations, to stay safe.
On those rare occasions when I buy stocks after a sell-off, I always look to ONE TOOL that tells me when the stock is finally starting to show enough strength that my odds of success have improved.
That tool?
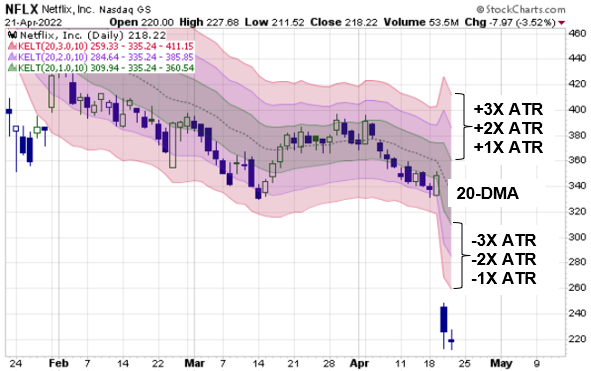
Keltner Channels (also called Keltner Bands).
This chart shows how I construct this tool.

Now, to answer my member’s question about how to draw these bands, you would do the following:
In stockcharts.com, which is where I build my Keltner charts, go to the Overlays section below the chart and simply select Keltner Channels from the dropdown menu.

I then repeat this two more times and simply go directly into the Parameters tabs shown above and change the middle numbers so that I have 1.0, 2.0, and 3.0X ATR set, then click update.
By the way, if you want to be part of a live roundtable I am going to host about betting against this market on Tues @ 2 PM EST next week, you can join me by clicking here to add the event to your calendar.
So, what’s my rule for using this tool?
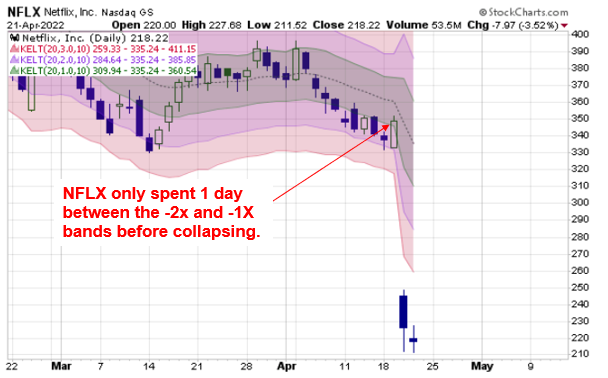
I want to wait for the stock to rise up from the -2X band and start to hold above the -1X band or preferably the middle average for at least two days as an indication that the stock is showing enough strength to possibly continue the reversal.

As you can see with NFLX above, the stock had only moved above the -1X band for one day before this past Wednesday’s overnight collapse occurred.
Not only that, but I would not have been caught in a bullish NFLX trade with earnings expected the next day.
Well folks, I hope this was a powerful lesson about how important it is to follow systems.
To YOUR Success!


