Tech has been taking a beating over the last couple of weeks as dollars are being rotated out of the tech sector due to inflation fears and high valuations. I think some tech stocks are definitely approaching good buy levels, but due to increased volatility, there are some other great places to look.
My favorite non-tech stock right now is Wynn Resorts (WYNN). Whilst WYNN has also pulled back significantly with most of the market, it is starting to consolidate and has not been as volatile as the tech sector….. This should make the stock trade a little bit cleaner and it could benefit significantly as investors seek real companies over money-losing dog meat tech companies!

Fundamentals
Wynn Resorts, Limited (WYNN) designs, develops, and operates integrated resorts and casinos. WYNN is historically a profitable business but was hit hard during the pandemic. In fact, it has not had a profitable quarter since COVID-19. However, it has lost less over the last 2 quarters, in Q3 they reported a loss of $848 million compared to a Q2 loss of $1.44 billion. The companies fundamentals are trending the right way as holiday-goers return to their resorts and casinos, in fact, it’s one of my favorites, I love going there.
I expect this seasoned company to continue to adjust to life post the pandemic and return to profitability sometime this year. Given that it is trading at a Price to Sales ratio of less than 3, according to Finviz, it appears to be very conservatively priced, unlike some tech stocks with outrageous valuations.
The Technicals

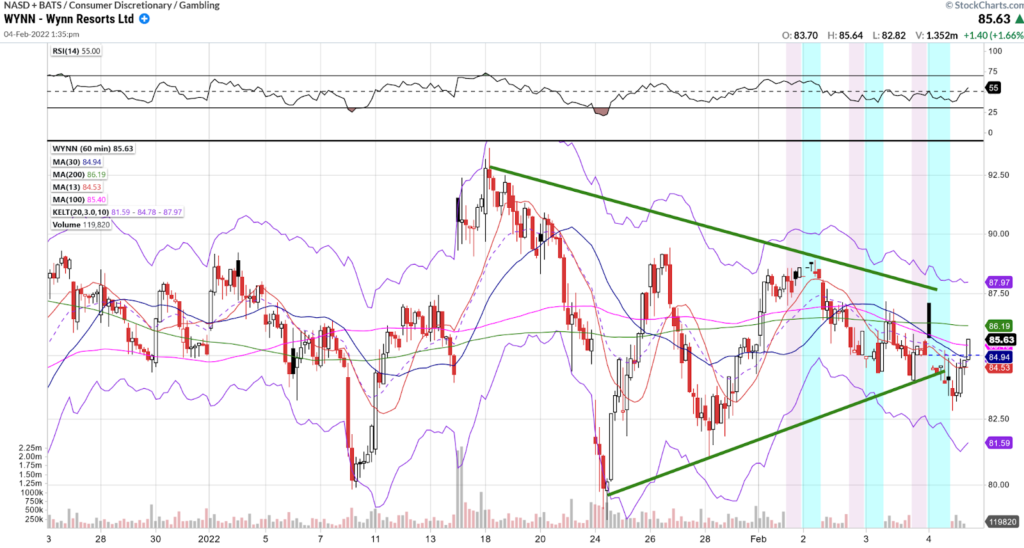
Wynn Resorts (WYNN) is forming a large pennant/consolidation pattern since the middle of 2021.
As buyers and sellers continue to fight for control, the price of the stock has moved inside a large range of $80 to $92.50.
I’m thinking that if the sellers continue to push lower I’ll start looking to buy near the lower support levels.
Right now I’m going to continue to watch the symmetrical triangle that is forming for a breakout in either direction.
Trade Lesson: Symmetrical Triangles
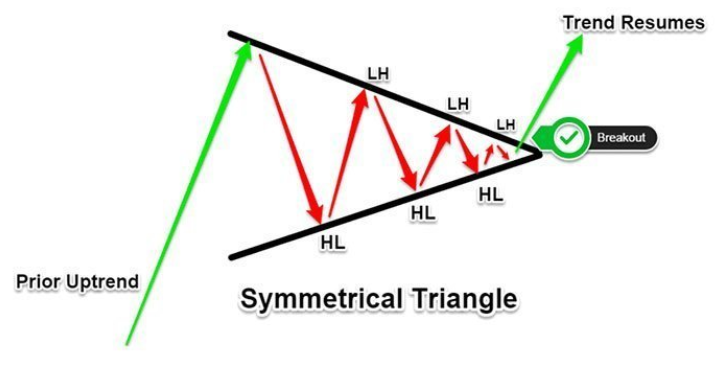
A Symmetrical Triangle is a chart pattern that is characterized by two converging trend lines that connect a series of sequential pivot highs and lows. These trend lines should be converging at a roughly equal slope.
Here is an example of how this looks in a stock chart.

What does a Symmetrical Triangle represent?
A Symmetrical Triangle chart pattern represents a period of consolidation before the price is forced to break out or break down.
A breakdown from the lower trendline marks the start of a new bearish trend, while a breakout from the upper trendline indicates the start of a new bullish trend. The pattern is also known as a wedge chart pattern.
Bottom Line
As investors start to shy away from volatile tech stocks, there could be a rotation into more conventional stable businesses. One such historically-stable company is Wynn Resorts (WYNN).
The business got hit hard by the pandemic but is recovering and could return to profitability this year. The fundamentals are trending the right way, and the stock is relatively cheap. It is also consolidating nicely from a technical standpoint. I am actively stalking WYNN for an entry, as I believe it could break out to the upside from the symmetrical triangle chart pattern.
Comments are closed.


1 Comments
Thanks, Jeff!