

Late last month, the Securities and Exchange Commission Chairman Gary Gensler said a full ban of the controversial payment for order flow (PFOF) practice is “on the table.”
According to the Securities and Exchange Commission, the practice is being reviewed and proposals to eliminate it could be presented in the coming months.
Gensler has in the past been critical of the payment for order flow practice, saying that it raises several conflict-of-interest questions.
Today, we’re going to take a look at the chart of one very popular online broker that has a lot to lose if this ban were to materialize.
What is payment for order flow?
Payment for order flow is a common practice in the investing world that lets retail brokers be paid by market makers, wholesalers and others in exchange for their retail clients’ orders to buy and sell securities.
Payment for order flow is of particular importance for small broker-dealers who may not be able to invest in the systems and technology to efficiently execute thousands of trades per day for their clients.
By sending their trades to large wholesalers to execute, they can offer faster service and provide additional revenues to offset the effects of charging lower commissions.
The economies of scale built by large wholesalers are made available to smaller firms and their clients, along with faster execution thanks to heavily automated electronic systems.
The Securities and Exchange Commission (SEC) requires that brokers disclose whether they are paying for order flow.
However, few investors check the disclosures and even fewer request the details to find out who is being paid and how much.
For many retail traders, whether their broker is benefiting from payment for order flow is not a major consideration.
Typical payments for order flow may be a few tenths of a penny per share.
For longer-term investors that typically hold positions for long periods to keep transaction costs low, these amounts are trivial.
However, for active traders who have many transactions the amounts can add up and may be of concern.
Robinhoods stock stock could suffer further
Payment for order flow is one of Robinhood’s (HOOD) largest revenue generators and is the primary reason the stock trading app can provide zero-commission trading fees.
Then, there’s the added competition that also appears to be on the horizon, with PayPal (PYPL) apparently updating its app to enable stock trading by customers.
PayPal could pose a legitimate threat to Robinhood for the following reasons:
- PayPal has over 400 million accounts, most of which are linked with users’ bank accounts, compared to just over 22 million accounts for Robinhood, allowing it to target a large pool of users who likely already have its app installed.
- PayPal is likely looking to use its stock trading features as a means of driving engagement to its app, so that it can sell its payments and other financial services. This could make it less reliant on trading revenues, giving it an edge over Robinhood.
While shares of Robinhood saw a roughly 50% spike higher in the days that immediately followed its July 29th IPO, the stock has done nothing but decline ever since.
It’s only been a little more than a month since Robinhood went public in late July, which means that a lot of the indicators that we might typically use to determine the strength of the current downtrend do not provide any historic context.

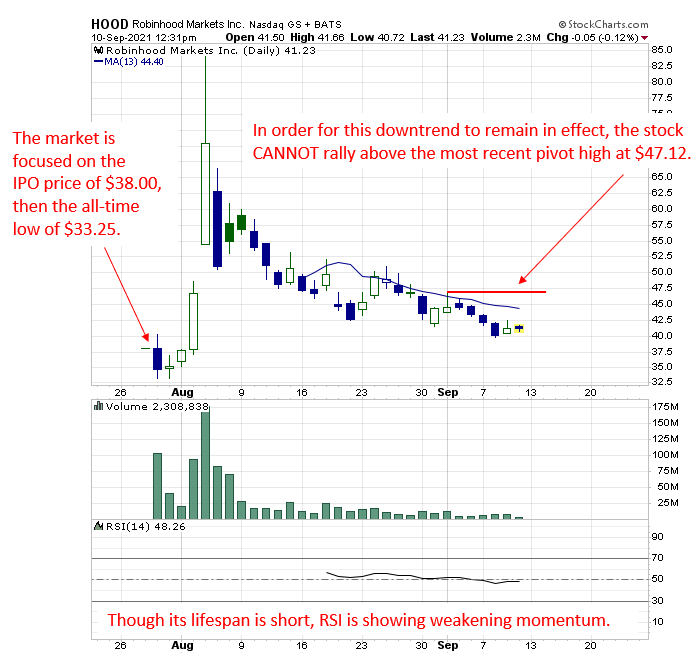
What we do know, however, is that IPO prices often act as a strong psychological magnet, similar to when a stock is rising to fill an overhead price gap or slowly declining to test former price support.
In this case, however, given the stock’s lack of price history, the IPO price of $38 is essentially the only psychological reference point at this time, making it an incredibly important level.
Figure 1
How might a trader approach this stock, given everything we’ve just discussed?
First of all, don’t overthink it.
First, focus on the trend, which is down.
Next, focus on the unfilled gap of roughly 9% to 21% down to the $38 IPO price and the all-time lows of $33.25, respectively. This is the target zone for a bearish trade.
Lastly, recognize that, if your plan is to take advantage of the lower trend, the stock CANNOT rally above the most recent pivot high at $47.12 in order for this downtrend to remain in effect. Therefore, this becomes your risk and protective stop.
Given that I prefer not to chase trades, I’d be looking to use any weak bounce up to between the lower sloping 13-day moving average (a key Fibonacci number that I like to use a lot), which is currently at $44.39 and the above-mentioned pivot high at $47.12 as an opportunity to STO (sell to open) a bearish put spread that would benefit from the passage of time (i.e., Theta decay) as shares of HOOD continue to work closer to the $38.00 IPO price.


1 Comments
very good put up, i actually love this website, carry on it