

After taking some time at the end of 2021 to reflect on what I can do to become better both personally and professionally, I am ready to take on 2022!
For me, on a professional level, my focus for the upcoming year is to make sure I am providing Total Alpha members with THE BEST market research and trading ideas money can buy.
To achieve this, I’m improving the charting tools I use each day to help members understand when the stocks that I’m looking to trade have reached important price points.
Today, I am going to show you the details of my new charting method and apply it to one of my favorite upcoming ideas that I’m getting ready to trade in the crypto space.
You may not realize it, but retail traders have several powerful quantitative tools at their disposal.
Some measure momentum, some measure trend strength, and others measure abnormally large price movement.
Like many things in life, when things go too far or last too long, rarely do they continue uninterrupted.
Well, in trading, the concept is the same when it comes to a stock’s price action.
That’s why I’ve decided to start plotting a tool called Keltner Channels on all of my charts as a way to help members understand when the stocks I’m looking to trade are either trading inside or outside of their normal limits.
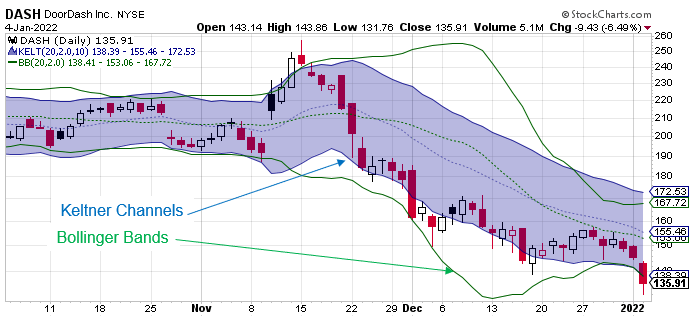
Not to be confused with the hugely popular technical tool known as Bollinger Bands, which measure price action based on standard deviation movement away from a central moving average, Keltner Channels measure a stock based on its volatility.
Specifically, by default, Keltner Channels measure 2 Average True Range (ATR) from a 20-day moving average.
Again, this is different from Bollinger Bands which measure 2 standard deviations away from a 20-day moving average.
The biggest difference, as Figure 1 below shows, is that Bollinger Bands have the potential to expand and contract rather violently based on changing volatility conditions, while Keltner Channels produce a much smoother measuring stick for finding support and resistance.
Figure 1
Like any indicator, Keltner Channels can be customized to fit your trading style.
As Figure 2 below shows, I’ve customized this tool in a manner that helps traders identify when one of my upcoming trading ideas, Grayscale Ethereum Trust (ETHE), is trading within normal ranges, abnormally large ranges, or extreme ranges.
Figure 2
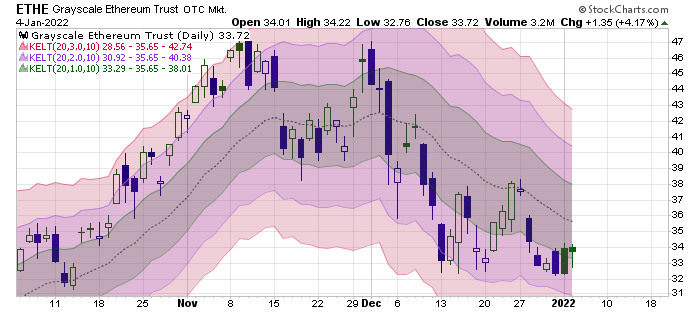
Specifically, the dark middle band on this chart measures 1 ATR above and below the 20-day moving average, which is the normal volatility range of ETHE over the past 10 days. Note: 10 days is the default lookback period for the ATR measurement.
Next, the purple bands measure 2 ATR above and below the 20-day moving average, which is the abnormally large volatility range of ETHE over the past 10 days.
Finally, the light red bands on the outside measure 3 ATR above and below the 20-day moving average, which is the extreme volatility range of ETHE over the past 10 days.
Before we continue, let me just say that if you’re interested in trading or investing in cryptocurrencies you need to check out Jake McCarthy and his Coin Command service. He is an expert in all things crypto and it’s fascinating to watch how he comes up with his trading ideas.
Getting back to ETHE, according to OTCMarkets, this investment vehicle enables investors to gain access and exposure to Ethereum in the form of a security without the challenges of buying, storing, and safekeeping Ethereum directly. Shares are distributed through sales in private placement transactions and become eligible to sell into the public market after a statutory six-month holding period.
While an investment in the shares is not a direct investment in Ethereum, the shares are designed to provide investors with a cost-effective and convenient way to gain investment exposure to Ethereum. The shares are quoted on OTCQX under the ticker symbol “ETHE.” ETHE’s investment objective is for its shares (based on Ethereum per share) to reflect the value of the Ethereum held by ETHE, less ETHE’s expenses and other liabilities.
Now, if we build on the new Keltner tool I’m now using, you’ll see that ETHE is currently showing signs that it is trying to form a base as it trades near the lower limit of what is considered a normal volatility range, within the 1 ATR band.
Figure 3
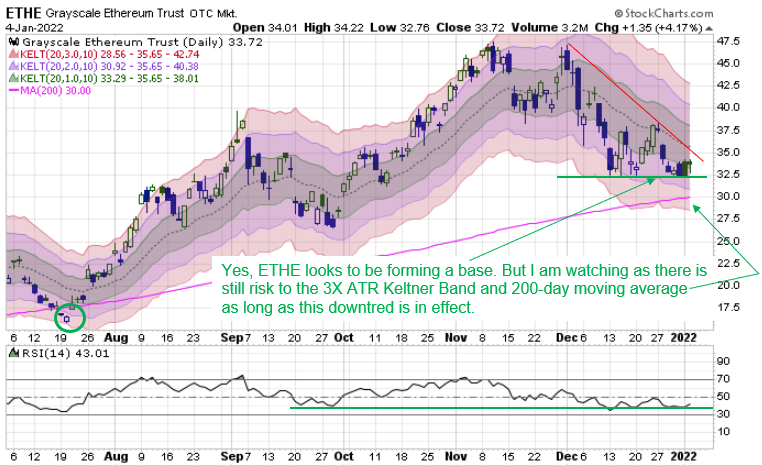
At the same time, I like that the RSI momentum indicator is also showing signs of basing right at the 40 level, which is a sign that the pullback in ETHE since early December is still healthy as far as the long-term trend is concerned.
How am I playing ETHE right now?
Right now, I’m just watching and waiting for signs that the bearish trend has begun to turn.
The reason for this is because, until the downtrend from early December is reversed, there is still the possibility that buyers may not be fully committed to enter until ETHE falls deeper toward the 200-day moving average and extreme 3X ATR Keltner Band, as was the case back in July 2021 (see green circle).
Of course, there is no guarantee that such a drop is going to occur, but the fact that the trend is still pointing lower suggests that there is certainly a risk that such a decline can occur.
To YOUR Success!


