

As you put more time into practicing to be the best trader you can be, you’ll come to learn that, more often than not, big market downturns usually do not just show up out of nowhere.
Sure, there are those rare occasions when unforeseen events such as the pandemic of early 2020 manifest into a brand market selling frenzy without warning.
But, again, these situations are so rare that it behooves you to not approach the markets with the expectation that the next major downturn will come without warning.
Instead, you need to train yourself to identify the breadth deterioration, momentum deterioration, and certain price patterns that typically telegraph big market corrections before they happen.
Today, I am going to show you one such pattern that seems to be forming in a sector that is viewed as being critical to gauging the market’s appetite for risk.
Discretionary stocks thrive during strong risk-on environments
Discretionary income is defined as the money that is leftover from an individual’s paycheck for spending, investing, or saving once essentials like taxes, shelter, food, and clothing have been paid for first.
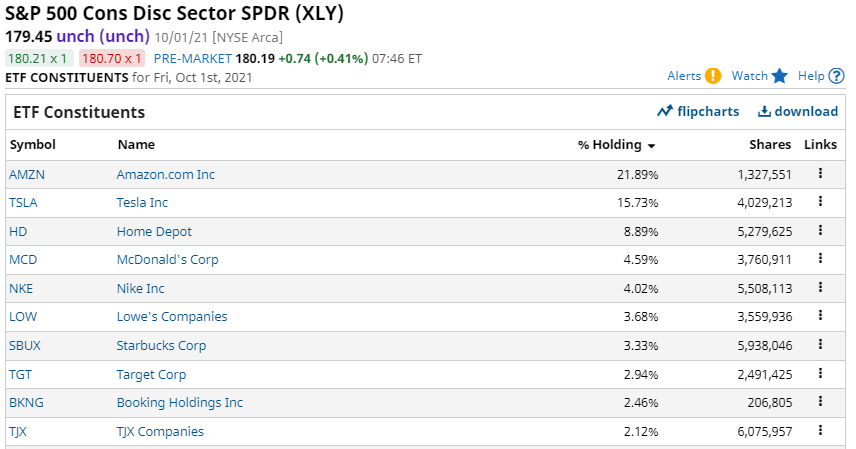
Therefore, when we think of stocks that stand to benefit during times when consumers have the confidence to spend their discretionary income, the first sector that comes to mind is the consumer discretionary sector, also known as the Consumer Cyclicals sector.
You’ll get a better sense of this when you view Figure 1, which shows the top holdings of the S&P 500 Cons Disc Sector SPDR F (XLY).
Figure 1
However, there is evidence to suggest that the bullish momentum and investor confidence that this sector has enjoyed in recent months is waning.
How can I tell this?
Simply by using pattern analysis.
What do price patterns tell us?
Though not perfect (nothing in trading is), price patterns offer a snapshot of investor positioning and sentiment.
The patterns of price movements reveal in real time the balance between the supply for sale and the buying demand of any given security or currency pair.
Any price change implies a shift in the relationship between buyers and sellers; an increase in supply will push the price down, while an increase in buying demand will drive price higher.
A price action trader that is bullish bases his or her trades on predictions of whether buying demand is greater than the supply of sellers, and therefore the price is poised to head higher.
Key elements of all patterns:
- A pattern is bounded by at least two trend lines (straight or curved)
- All patterns have a combination of entry and exit points
- Patterns can be continuation patterns or reversal patterns
- Patterns are fractal, meaning that they can be seen in any charting period (weekly, daily, minute, etc.)
- A pattern is not complete or activated until an actual breakout occurs
The discretionary sector seems to be forming a rising wedge/ending diagonal
Traditional, western-based technical analysis refers to the pattern I am about to show you as a “rising wedge,” while practitioners of Elliott Wave analysis will call this pattern an “ending diagonal.”
This pattern is a type of distribution pattern (i.e., net selling is occurring during its creation) pattern that is usually found at the completion of a strong move.
It reflects a “waning” of bullish market sentiment such that price still moves generally in the direction of the larger move, but not strong enough to produce a sustained confidence move higher.
When we look at a chart of the consumer discretionary sector, a very similar pattern can be seen.
Figure 2 –
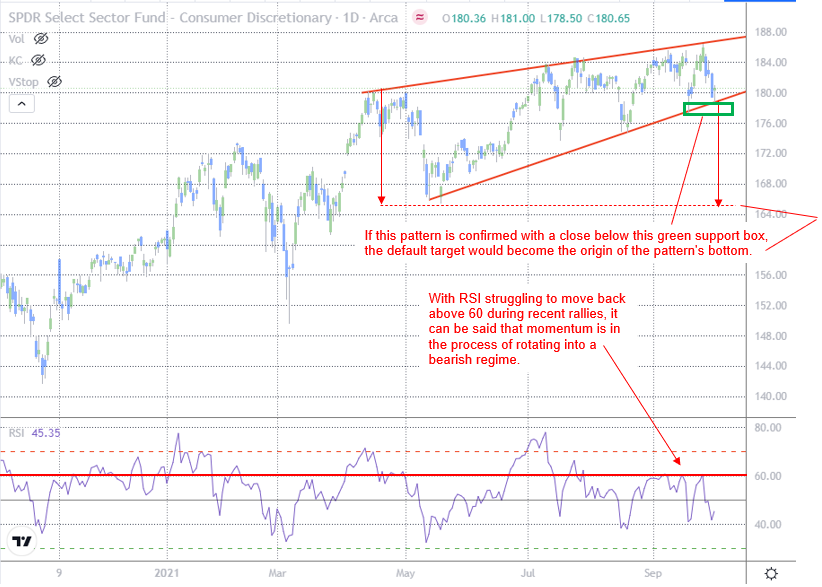
When familiar patterns start to develop, we have to respect them for what they stand for.
In this case, if this is indeed a terminal/topping pattern that is eventually going to lead to a meaningful pullback, the pattern would not be confirmed until we witness a close below the pattern’s lower support line, which currently sits near 178.60.
If the pattern were to actually work, the downside target released by the pattern would be 8.0% lower than current levels, at 165.50.
How might a trader trade this pattern?
There are a number of ways pattern traders approach patterns in general.
If we were to use a bearish pattern such as this as an example, one popular method would be to enter a portion of the desired short position as the pattern is still developing, preferably as close as possible to the resistance of the pattern.
The trader would then enter the remaining portion of the desired position upon downside confirmation of the pattern.
Or, the trader would just wait for a downside confirmation break to enter the entire position.
As of Friday’s close, this key sector remains inside of this still-developing pattern, so another bounce toward the high-end of the pattern is entirely possible.
Should such a bounce occur, I’ll be looking to use it as an opportunity to either short the index or one of its many constituents that trade with a high correlation to the XLY.
From an Intermarket perspective, should this bearish pattern ultimately become confirmed with a close below the 178.60 to 177.38 area, it would be a signal that risk appetite has suffered a meaningful breakdown, which could lead to an uncharacteristically long period of increased volatility across the broader market indices.


1 Comments
A good red alert.
Warm regards.