

I know it sounds a bit cliche, but timing really is everything when it comes to trading.
Rather than talking about timing trade entry points, the timing to which I am referring is the location of a stock’s price at the time major news becomes public information.
For instance, one of the more perplexing things that can happen to a trader is seeing a seemingly bullish headline hit the wire, then reacting to that news by establishing a long position only to see the market go completely against the position.
More often than not, the phenomenon I’ve just described tends to happen after there’s already been a big move in anticipation of this news, in an age-old occurrence known as “buy the rumor, sell the news.”
However, there are other times when a stock or sector is greeted with favorable news that isn’t necessarily expected, at a time when the technicals are not extended.
This is seemingly what’s been going on in the basic materials sector of late, specifically in certain companies whose business is centered around the mining and refining of copper.
Today, I am going to show you how to spot sectors that are starting to build relative strength vs. the benchmark S&P 500. In addition, I am going to show you one basic materials stock that just broke above a bottoming pattern and looks to build on this breakout with support from the White House.
Copper is poised to benefit from the future of Electric Vehicles (EV)
On August 5th, the White House announced a goal for 50% of all cars, trucks, and SUVs sold in the US to be fully electric, plugin hybrid, or fuel cell by 2030.
If we extrapolate out just a 1% annual growth in US new car sales through 2030, we’d be looking at around 19 million cars sold.
Assuming the White House’s goals are met, that means we’d be looking at about 9 million alternative energy vehicles sold in just the next 9 years.
Some of the most profitable investments are what is known as “picks-and-shovels” investments.
In other words, rather than investing directly in shares of a company like Tesla Inc., you would purchase shares in the companies that make the tools or produce the materials that are essential in the production of Tesla vehicles.
Therefore, when we’re talking about the possibility of a massive government initiative such as the one discussed above coming to fruition, we must take a close look at some of the raw materials companies that would stand to benefit.
EV production requires massive amounts of raw material inputs
To develop an electric vehicle requires about 4x the amount of copper as a traditional combustion vehicle.
Electric vehicle development requires large amounts of lithium, nickel, and cobalt, as well.
For today’s discussion, though, we are focusing on the copper aspect.
The company I’m keeping an eye on in this space is Southern Copper Corporation (SCCO).
The company engages in mining, exploring, smelting, and refining copper and other minerals in Peru, Mexico, Argentina, Ecuador, and Chile. The company is involved in the mining, milling, and flotation of copper ore to produce copper and molybdenum concentrates; smelting of copper concentrates to produce blister and anode copper; and refining of anode copper to produce copper cathodes.
At the opening of this discussion, I suggested that, when it comes to trading the news, the timing of press releases in relation to a stock’s technicals is everything.
In the case of SCCO, the August 5th announcement came at a time when the stock was sitting with bullish-to-neutral momentum, and holding above former resistance turned support after a recent break above a small double bottom.
Figure 1
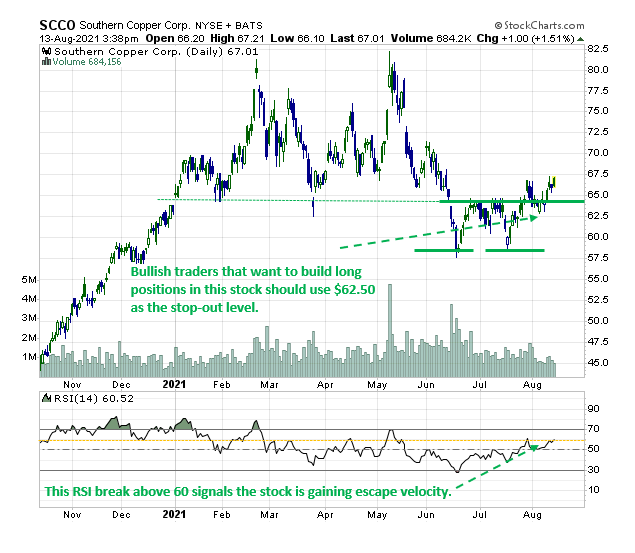
Technically, this is what you could call the “sweet spot” for a stock that has just absorbed supportive headlines.
Now, it’s important to understand that this absolute price analysis is just one layer of the work that needs to be done to identify high-probability trades.
Another layer is to compare the absolute price performance to that of the benchmark (relative strength analysis) to confirm that the stock is being overweighted by investors.
Here’s how to spot sectors that are starting to build relative strength
Relative Rotation Graphs are readily available on a number of charting platforms these days. Today, we’ll be using the version provided on the Stockcharts.com website.
Stockcharts.com describes RRG charts as follows: RRG® charts show you the relative strength and momentum for a group of stocks. Stocks with strong relative strength and momentum appear in the green Leading quadrant. As relative momentum fades, they typically move into the yellow weakening quadrant. If relative strength then fades, they move into the red lagging quadrant. Finally, when momentum starts to pick up again, they shift into the blue improving quadrant.
The clockwise rotation that occurs on these charts is very effective when prospective buyers of stock are trying to find the early stages of a leadership cycle, or when prospective sellers are trying to identify early signs of deterioration.
In both cases, the comparisons are made relative to some benchmark, which in many cases is the S&P 500.
For the example above, we’re looking at all 11 S&P 500 sector ETFs relative to the S&P 500 ETF (SPY).
Figure 2
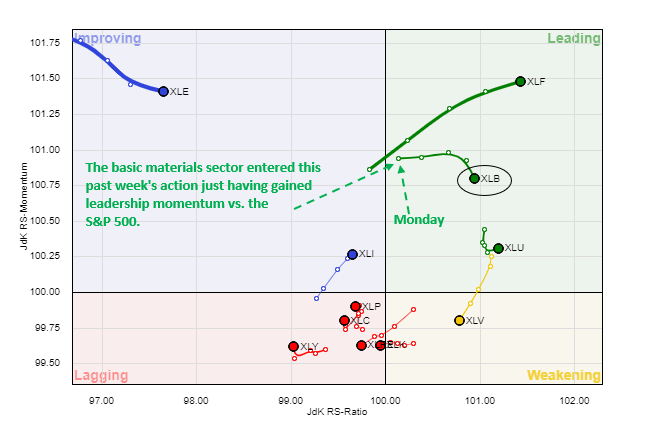
Though not visible on the graph above, the SPY is positioned at the origin (i.e., where the X and Y axis meet).
The long tails left behind by each sector are meant to help the viewer track each sector’s relative path over the past 2 weeks of trading.
The message that was being signaled by this graph at the start of this week’s trading was loud and clear.
Specifically, the basic materials sector was just starting to outperform the S&P 500 at the start of this past week (see green arrow highlighting the performance tail of the past 5 days).
How should traders use this bullish information?
This combination of a stock consolidating above a recent breakout area as it is gaining relative strength against the benchmark at a time of favorable news flow is a highly sought after setup that can often lead to momentum breakouts.
On the subject of a momentum break, this week’s RSI close above the 60 level is a development that could propel things higher, since RSI breaks above 60 often mean bullish escape velocity has developed.
With all this in mind, the most obvious level to use as a stop-out on newly established long positions is the most recent pivot low area near $62.50 (see Figure 1), as a breach of this level would signal that the bulls have failed to generate immediate bullish trend development.


3 Comments
Really liked this analysis technique! I will try this relative strength comparison. Thanks
Dear Sir,
You have a down home way of delivering information that is easy, clear and even seemingly personal that makes learning with you a joy Mr. Bishop thank you!
Daniel Onzo
First of all, thank good.
Great topic and supportive material introducing an upcoming market trend.