

Today I’d like to discuss a helpful indicator I use to help me make trading decisions. TTM Squeeze is a volatility and momentum indicator, which capitalizes on the tendency for price to break out strongly after consolidating in a tight trading range.

This aligns with my favorite trade setup, the flagpole consolidation.
Like any indicator, there is some nuance to how I use it, and I will be explaining just that.
TTM Squeeze Indicator Explained
The volatility component of the TTM Squeeze indicator measures price compression using Bollinger Bands and Keltner Channels. If the Bollinger Bands are completely enclosed within the Keltner Channels, that indicates a period of very low volatility. This state is known as the squeeze. When the Bollinger Bands expand and move back outside of the Keltner Channel, the squeeze is said to have “fired”: volatility increases, and prices are likely to break out of that tight trading range in one direction or the other. The on/off state of the squeeze is shown with small dots on the zero line of the indicator: red dots indicate the squeeze is on, and green dots indicate the squeeze is off.
The TTM Squeeze indicator also uses a momentum oscillator to show the expected direction of the move when the squeeze fires. This histogram oscillates around the zero line; increasing momentum above the zero line indicates an opportunity to purchase long, while momentum falling below the zero line can indicate a shorting opportunity.
How I Use It
However, given the state of the markets, I only use the TTM Squeeze indicator to go long. You see, we are in a cyclical bull market. With the amount of Fed purchases and trillions in savings on the sidelines I am not one to fight market fundamentals. I like to get long strong stocks. My favorite setup is a strong stock that has pulled back and begun consolidating. I call this the flagpole consolidation. I use this consolidation as a place to enter for a possible further up leg. You can read more about my favorite setup here.
The TTM Squeeze helps me get confirmation on a possibly great entry on my favorite stocks. I do not use this indicator to short strong stocks that may go higher; that is part of my trading strategy in these markets.
There is some nuance to how I use the TTM squeeze indicator. For example, as I have already mentioned, I do not use it to go short. The indicator is great at finding good entries on strong stocks. However, as it is not that great for me in timing exits.
Nuance and Traps to Avoid
Furthermore, the timeframe you choose to use this indicator on is also important. I prefer to use this indicator on the Daily timeframe or above, for example, the weekly or monthly. I do have it on my 60minute charts but prefer to use this indicator on the daily for bigger picture trend guidance. I personally am not a day trader and would not recommend it on lower timeframes due to the possibility of many false signals. I prefer to use it on larger timeframes to confirm the likelihood of trend continuation on the long side.
Signals
The TTM Squeeze indicator has both volatility and momentum components. The Squeeze dots signal when volatility conditions are right to buy; the momentum histogram indicates the direction (long or short) in which to trade.
While volatility levels are low, the squeeze dots will be red. When volatility increases and the Bollinger Bands expand until they are outside of the Keltner Channels, the squeeze has “fired” and the squeeze dots will be green. A buy signal is on the first green dot after one or more red dots.
The momentum histogram helps to determine the direction in which to trade. If the momentum is above the zero line and rising (light blue bars), buy long; if the histogram is below the zero line and falling lower (dark red bars), that indicates a shorting opportunity. However, I only look for trades on the long side.
The histogram bars are color-coded for ease of interpretation. Bars above the zero line are blue and below the zero line are red. In addition, a bar that is lower than the previous bar will be a darker color (dark blue or dark red), and a bar that is higher than the previous bar will be a lighter color (light blue or light red).
Price moves after a squeeze fires tend to last for 8-10 bars. When the histogram changes direction and starts moving back towards the zero line, that is a signal to sell. As I mentioned, the sell signal may be late on some occasions and early on others. I prefer to use my pre-determined price targets to exit and might use RSI or measured moves to help me exit a trade.
Examples
Let us take a look at a few examples:
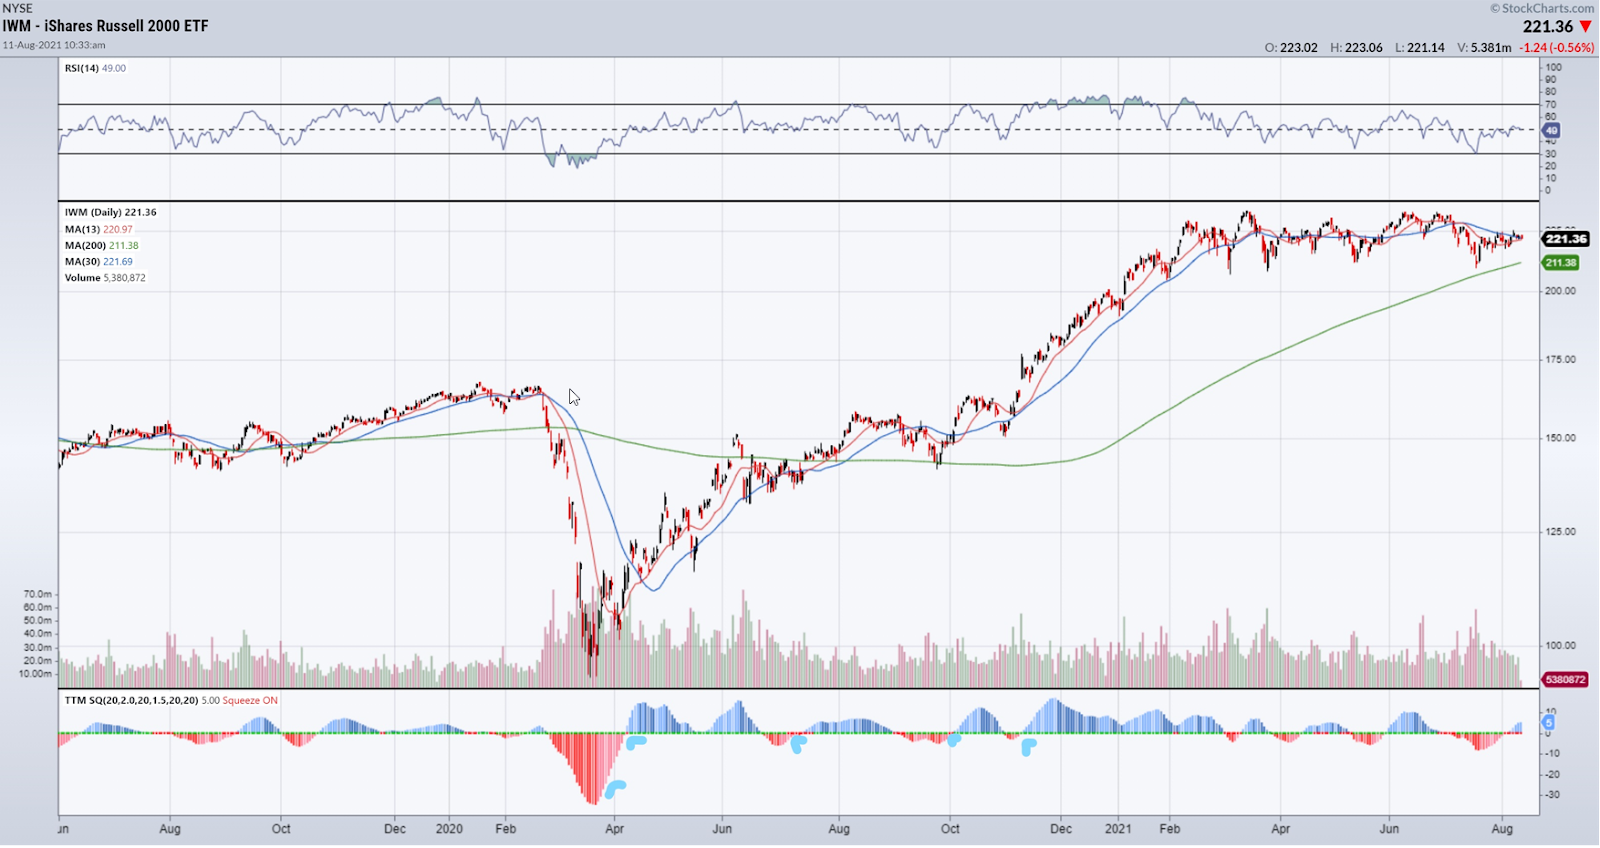
Daily Chart of IWM, signals highlighted with blue arrows at bottom
Here is a daily chart of IShares Russell 2000 ETF (IWM). We can see the TTM Squeeze indicator gave a perfect signal of the Covid bottom in March 2020 when the red bars started to reduce in size. It also showed us the higher low in April when the squeeze was off (red to blue as it crossed 0), although the signal occurred a few days after the higher low.
We have three more signals highlighted, great spots to get long during consolidations in IWM, which led to nice moves higher. Obviously, it’s much easier in hindsight but it is a great Indicator that helps me trade with the trend on entries.
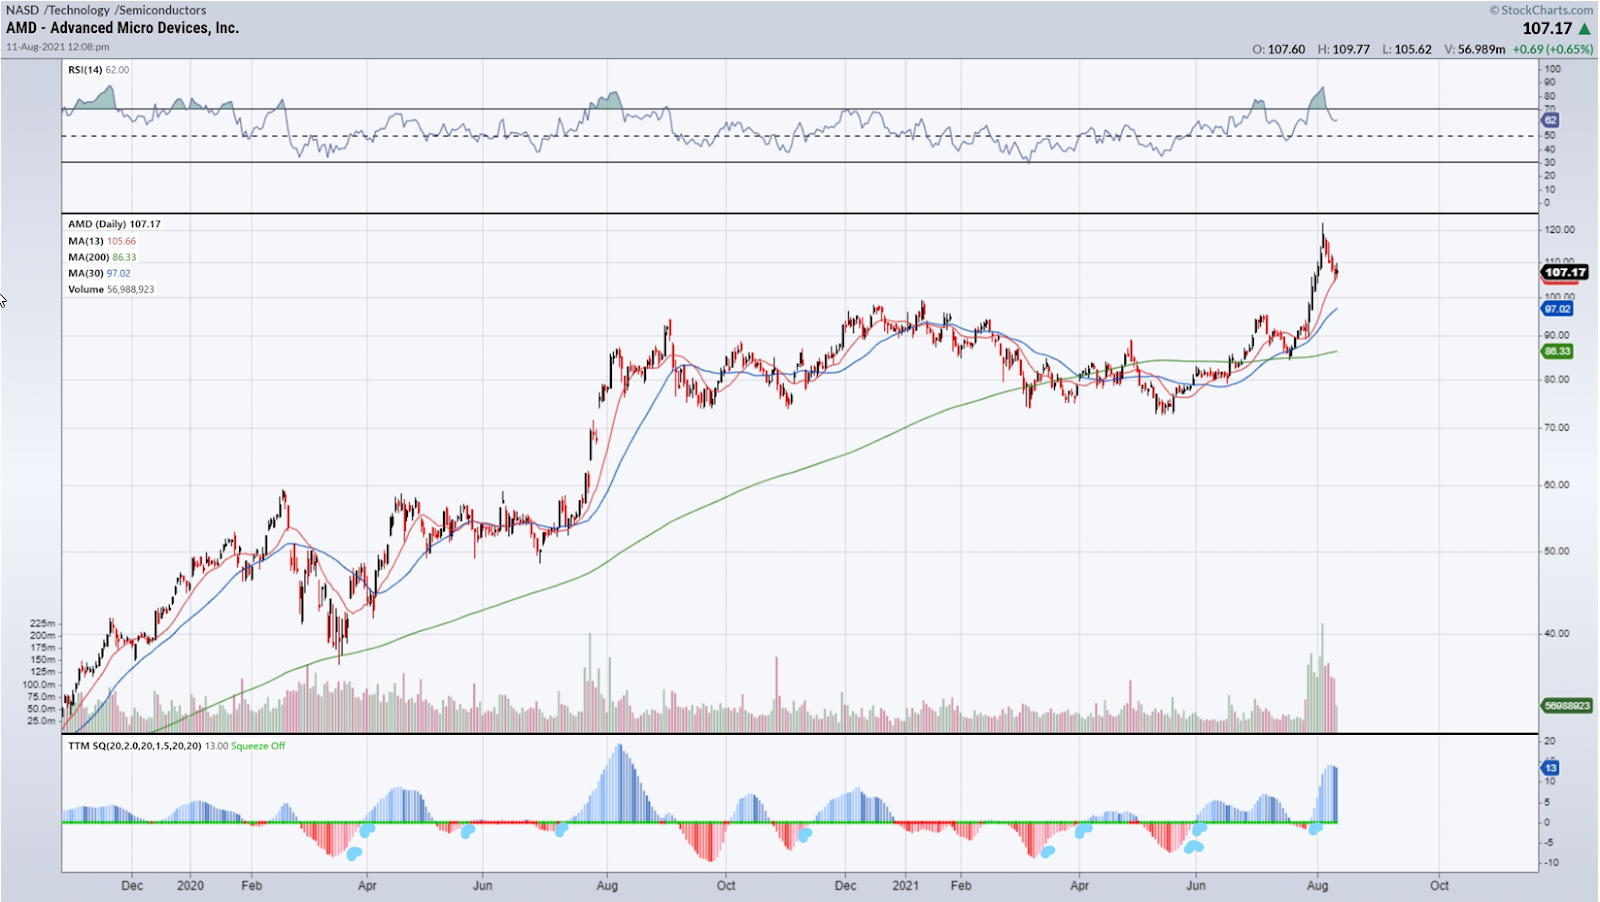
Daily Chart of AMD, with signals in blue arrows at the bottom
Let’s take a look at AMD, another hot stock in a hot sector. Just like IWM, we had great signals in March and April 2020. We had a great signal in July 2020 for the August breakout. We also had a great signal in late July 2021 for the recent breakout in August. Notice these were some very large, sustained moves after either a major selloff or long periods of consolidation. There is an old trading adage, “the bigger the base, the higher in space”, these were great examples.
Now, this signal does not always work. We had some false signals in AMD in June 2020, October 2020, and Feb 2021. However, as always prudent risk management would make sure that the setup ups that worked would outweigh those that failed due to the size of the moves on the winners.
Bottom Line
TTM Squeeze is a volatility and momentum indicator, which capitalizes on the tendency for price to break out strongly after consolidating in a tight trading range. This aligns with my favorite trade setup, the flagpole consolidation. I like to use this indicator on higher timeframes such as the daily to help me confirm a trend and when a breakout may happen. There is some nuance to using this indicator, and it is an added tool I use to help identify great entries on stocks that I like and am looking to get long.


2 Comments
Thanks for the tutorial. I have used the TTM too but gave up on it. With your input to use on longer time frames I’m going to give it a try again. Thanks!
Touche. Sound arguments. Keep up the amazing spirit.