
When it comes to trading indicators, I like to keep my charts pretty clean with the bare essentials for my trading. I use the 13, 30, and 200 simple moving averages and a 14 period RSI based on a 1hour timeframe chart to help me identify the trend.
Recently, I’ve decided to add another quiver to my arsenal, that being Volume Weighted Average Price (VWAP). Thanks to my friend Kenny Glick for putting me on to this. Having seen the benefits of this tool, I’ve decided to co-opt it into my trading process.
Today I’m going to share with you the details of how I’m implementing it and how it can be used to make more informed trading decisions.
VWAP gives the average price traded throughout the day or over multiple days based on both price AND Volume. It has advantages over classic moving averages which incorporate only price in their calculation.
Institutions and VWAP
Institutions are measured against VWAP as to how well they have performed in selling or buying stock for a client. For example, consider a large institutional customer who has instructed his institutional broker to buy a large amount of APPLE INC (AAPL) on a particular day.
What does the broker do? The order is so big that they will not buy it in one go usually, unless they do a block order in a dark pool with another institution which we will discuss another time.
They will fill the order in smaller lots throughout the day so as to have as little impact on the current market price of the security as possible and get the best possible prices for their clients.
You could imagine what would happen if the broker bought all the stock at once with a market order. The price would go up very quickly giving the client a terrible average and once that demand is gone the stock would probably fall back to where it came from.
In fact, most institutions have algorithms programmed to execute large client orders based off of the VWAP.
Here is VWAP in Action:
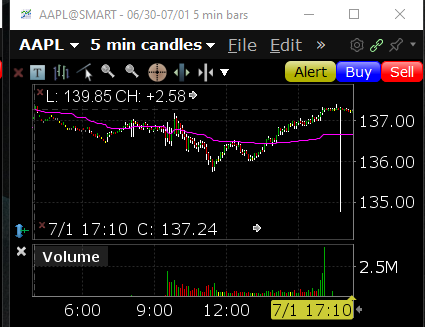
The pink line above is the intraday VWAP, you can see that it finished the day at 136.50 while price closed at 137.27 on this day. A client that is buying would be much happier to have their order’s filled as close to VWAP as possible rather than significantly above.
Using VWAP to Make Trading Decisions
So how can VWAP help us to make trading decisions? VWAP can help us do a number of things
- Identify Trend
- Identify Where market participants (buyers and sellers) may be positioned
- Identify areas of Potential Resistance and Support
Let’s discuss point number 1 today.
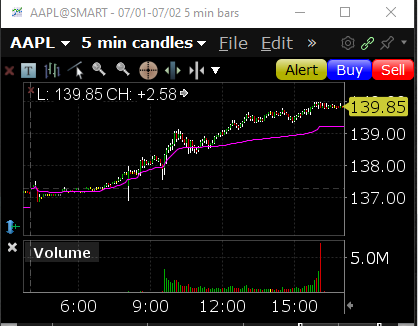
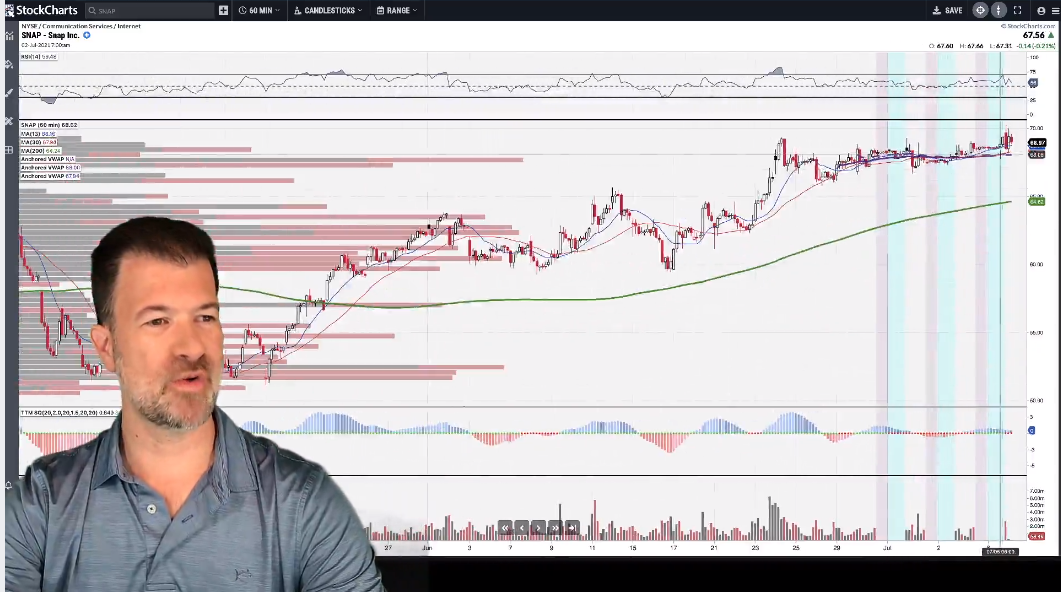
Identifying The Trend
Looking at the chart of AAPL we can see that it opened strongly with a hammer moving up off the open holding its gap up, pulled back into VWAP where there was a large exchange of shares for over an hour. VWAP held, and the stock trended the rest of the day.
Surely it was no coincidence that support for the stock was right at VWAP (perhaps some large Institutional orders buy orders being filled as we had discussed?).
Clearly, the trend of VWAP since pre-market and for the rest of the day was up, just by looking at the direction of the line representing VWAP. This is also how VWAP can be used as potential support or resistance, especially in a trending stock!
We can use this indicator to avoid being on the wrong side of a trend. For example, if VWAP is sloping upwards we may not want to short stocks against the trend while this is the case or perhaps at the very least we will avoid shorting into VWAP where there may be large institutional orders waiting to be filled.
Bottom Line
VWAP is an indicator that I have recently added to my trading arsenal. Institutions use it to judge how effectively client orders are filled. Algorithms are used by institutions programmed around VWAP to fill client orders and funds to take advantage of price action around VWAP. It is also a useful indicator to make trading decisions, and we will discuss more ways to do this.


21 Comments
thanks
Super helpful!!
Love this explanation. I have been including VWAP in my charting but this explains what to do with if there is a gap in trading prices and VWAP. Appreciate your taking the time Jeff!
Thanks
I am interested in learning more about VWAP.
So would be interesting to see the same chart with ur sma’s on it also? From my little experience it seems that pullbacks/pull-ups r also running into ur sma’s as well. Ur thoughts. Obvious question, why need all that on chart? Ur expertise is very appreciated!!
Where can I find the VWAP indicator for MT4 platform?
What is the difference between VWAP and Anchored VWAP and when to rely on one or the other. Thanks, Rod
Hey Rod! VWAP and Anchored VWAP are the exact same, the only difference is anchored VWAP shows the recent VWAP (depending on your timeframe for your chart). That way you don’t see the VWAP from months ago, rather the last few days or weeks.
Does the vwap have have indicators or do i have to figure out the vwap myself
Hi Jeff, thanks for this write up. I too have been watching Kenny like a hawk. I absolutely love this tool and watching Kenny at 1am (Singapore time) every evening. I learn so much from the snippets of learning he provides. Just have to learn how to put this all into practice and have conviction to trade what’s in front of me when the set up shows itself.
Hi Jeff……Many Thanks.
Is VWAP similar to VWMA ( Volume Weighted Moving Average ) and can I
substitute one for the other…..the reason I ask is I am in London and use the local IG Platform which does not have VWAP….Will appreciate your comments.
Good Stuff Jeff. I’m on board with you now and a naked (mostly) Put seller about 60 days out looing for two levels of support. Seem s to be working. Short term trends are mostly losers for me
Slainte
Pete Byrne
Continue your focus on vwap please Jeff.. need more of your insight..
Very helpful, I’m so proud of you, yes always I’m proud of you. Thank you.
Hey Jeff How do you get the multi VWAP?. It doesn’t come op on studies
Great stuff! Thank you! KD
Thanks for sharing Jeff! This information is quite informative!
The problem is that you don’t know which way the price will go from the VWAP. It can bounce off in either direction or crash through. Solid Jello software is very expensive for the individual invester. Kenny Glick (The Warlock of the VWAP) uses the Solid Jello software to show the multi day VWAP.
TOS there is code i found online to program multiday vwap. Basically anchored vwap. You just adjust the date to any where you want it anchored. Kennys multi day is anchored to 2009 on his charts. You can see the date in his vids on top of charts in yellow. Dont think he uses solid jello. Its code on think or swim. He learned it from zach hurwitz. Google him
TOS there is code i found online to program multiday vwap. Basically anchored vwap. You just adjust the date to any where you want it anchored. Kennys multi day is anchored to 2009 on his charts. You can see the date in his vids on top of charts in yellow. Dont think he uses solid jello. Its code on think or swim. He learned it from zach hurwitz. Google him