

Like Japanese candlesticks?
Then stay with me to the end for one of my BEST trade ideas for next week that uses a version of candlestick charting that’s ON STEROIDS!
I just introduced an innovative trade idea generator that is built around a version of candlestick charting which is OPTIMIZED for even better performance!

So why have I done all the hard work to bring this new system online?
Well, ask any professional trader and they’ll tell you that NO trading strategy works 100% of the time.
It’s adapt or die in this business, and BOY, OH BOY have I adapted…with this INCREDIBLE offer on my new Bullseye Unlimited service!
I am not ashamed to say that my 13/30 High Octane Scanner has not been effective in this market. Knowing when you are wrong quickly is the KEY to success in this business!
Market conditions simply are not what they need to be for this algorithmic system to perform efficiently.
So what did I do?
With the help of my team I built a NEW system that is a BEAST!
Put another way, I built a trade idea generator that:
- Is EVEN MORE POWERFUL
- Produces even DEADLIER, HIGHER QUALITY trade ideas
- Takes LESS TIME to find ideas
And it all centers around an optimized version of candlestick charts called Heiken-Ashi.
The combination of ALL these elements results in a POWERFUL new trade idea generator that you will NOT find anywhere else!
When something is optimized in trading, that means it has gone through changes and rigorous testing to make sure it is even better than the original.
So, what Is the Heikin-Ashi Technique?
This form of candlestick charting averages price data to smooth out the sometimes choppy, noisy market signals that often come with traditional candlestick charting.
Heikin-Ashi charts use a modified formula based on two-period averages, instead of using the open, high, low, and close like standard candlestick charts.
Again, this results in a smoother appearance, making it easier to identify trends and reversals.
As an example, I’ve applied this method to one of my favorite stocks that I am looking to trade next week.
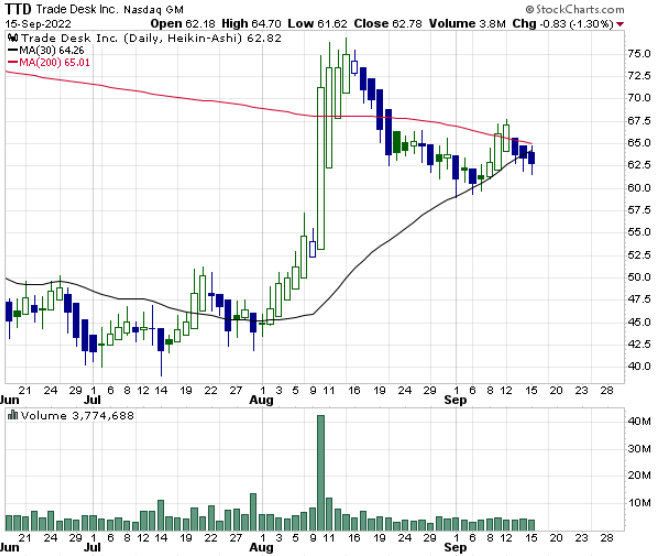
My scanner recently picked up TTD as it has been struggling to break above its 200-DMA and recently slipped below support from the 30-DMA.
These are KEY moving averages I’ve been using throughout my storied career and I’ll be looking to trade this name to the downside here next week.
Folks, my new Bullseye Unlimited plan is a RIDICULOUS value. So if you’d like to learn more about our payment plan, CALL OUR TEAM NOW: (800) 585-4488!
Or email: support@ragingbull.com
To YOUR Success!


