The market has been a paradise for momentum traders lately. High-flying stocks across multiple sectors have been making new all-time highs daily.
One sector, and two names, in particular, have caught my attention. The biotech industry, and specifically vaccine related stocks, have been running rampant lately. Of course, I am talking about MRNA and BNTX.
Yesterday alone saw Moderna close up 17.10% on the day. MRNA is now up 108.10% on the month. BioNtech closed the day up yesterday 14.97% and so far, up 105.72% on the month. The biotech ETF IBB closed up 2.38% yesterday, at new all-time highs of $176.21.
Nothing goes straight up or down in the market forever. Along the way, there will always be pullbacks, consolidations, and corrections.
So what exactly am I looking for in MRNA and BNTX? What are the key levels to be aware of?
Moderna (NASD: MRNA)

Is MRNA extended?
- MRNA has an average target price of $184.92. This number is well below the closing price of shares yesterday ($484.47).
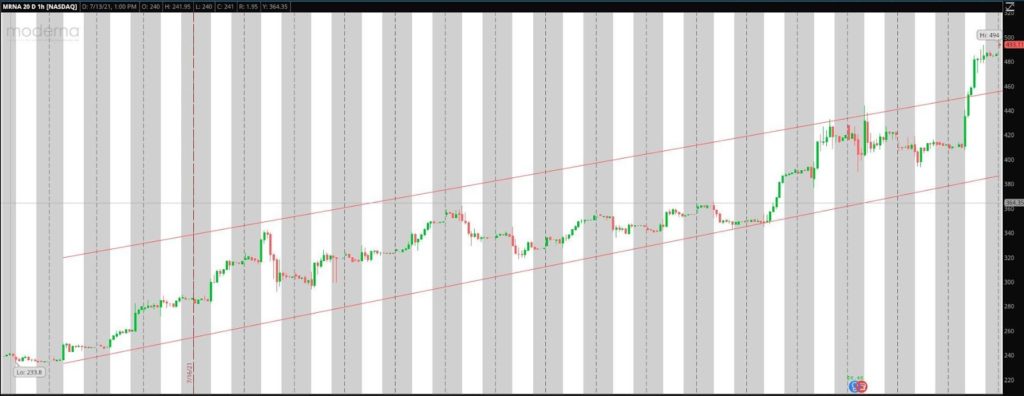
- Shares of MRNA are extended from key moving averages, as seen above. Shares are significantly extended from the 20d, 50d, and 200d SMA.
- Since breaking out over $200, MRNA has more than doubled in share price.
- Volume has increased in the last month, and the daily range has begun to extend, signaling a top and pullback is close.
Below is another chart that shows the MRNA extension:

MRNA has experienced incredible momentum since breaking out over $200. However, lately, price action has increasingly accelerated to the upside. The result has been a sharp move over the resistance of the increasingly upward trendline and the stock going parabolic. This is a clear signal to be cautious. The price action firmly signals to me that a pullback is likely to occur shortly.
The Pullback Trade Plan With MRNA:
As the stock approaches $500 and likely gets above this level, it will become a significant level of interest. $500 is a key psychological level and potential resistance zone. As it is clear that the stock is in the process of going parabolic, I will be watching for signs of resistance and selling. Specifically, I will want to see price action confirm that the short-term top is in. This might happen by the stock pushing higher in a short period and then immediately failing and giving back the day’s move. The stock could also consolidate below the day VWAP and then break lower and go red. Lastly, I will also be on the lookout for the stock to push higher, make a lower high, and then proceed to trend lower and go red. These are the various scenarios that I have prepared to identify a pullback and potential short trade.
BioNTech (NASD: BNTX)

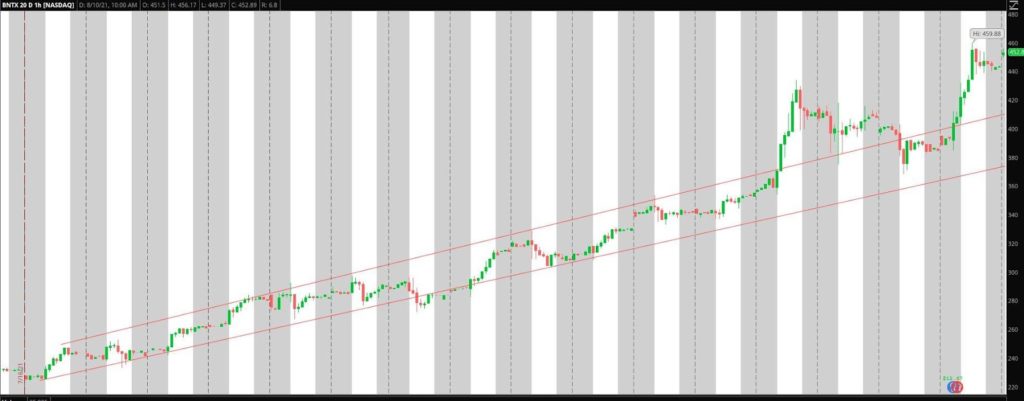
Similar to MRNA, BNTX is also extended from crucial moving averages. The average target price set by analysts is $195.09, which is well below the close of yesterday ($447.23). Since breaking out over $250, shares of BNTX have almost doubled. This stock has been an exceptional momentum play. However, all signs now point to a pullback.

The above chart also mirrors that of MRNA. Shares of MRNA steadily trended higher, and as time went on, the range began to expand, and volume has increased, signaling that a top may be close.
The Pullback Trade Plan With BNTX:
My thoughts here are similar to those of MRNA, as both stocks are correlated. With BNTX trading at all-time highs and approaching $500, I will be on the close lookout for signs of selling and resistance. If the stock fails to hold the intraday up -rend and VWAP, then I might go short. Alternatively, If the stock has a quick, explosive push higher and then proceeds to give it back and fade off, I would look for a lower high as confirmation to potentially position short. Lastly, If the stock consolidates and then breaks lower and goes red on the day, I might go short for a trend lower.
Comments are closed.


1 Comments
very informative.