Hello Trader,
We are currently experiencing a HOT small-cap and low float environment. This week multiple low float names have moved 100% + intraday. Names like CEMI, IPA, NURO, just to name a few.
These euphoric moves can easily cloud your judgment and lead you into thinking that whatever stock is gapping up is sure to be the next one!
I’m here to tell you that is not always the case, and if you are not careful, you could fall victim to the FOMO. And guys, I don’t want you holding the bag, so please read carefully below to identify the red flags BEFORE you go long!
A perfect example of this is India Globalization Capital. Inc. ( AMEX: IGC) from yesterday

IGC, per Finviz, engages in the development of cannabinoid-based therapies for indications such as Alzheimer’s disease and pain. It operates in two lines of business, Infrastructure and Life Sciences.
From Finviz
FLOAT: 28m
SHORT FLOAT: 11%
MARKET CAP: 115m
What was the catalyst to gap the stock higher?
Yesterday the company announced, per Business Wire, that on July 20, 2021, the United States Patent and Trademark Office (“USPTO”) issued a patent (#11,065,225) for the treatment of Alzheimer’s disease entitled “Ultra-Low dose THC as a potential therapeutic and prophylactic agent for Alzheimer’s Disease.”
So hold on! The stock has a small float, a catalyst, breaking out of a downward trend daily, a short interest, and the current environment favors the bulls. So why the heck did this stock not go to the moon??
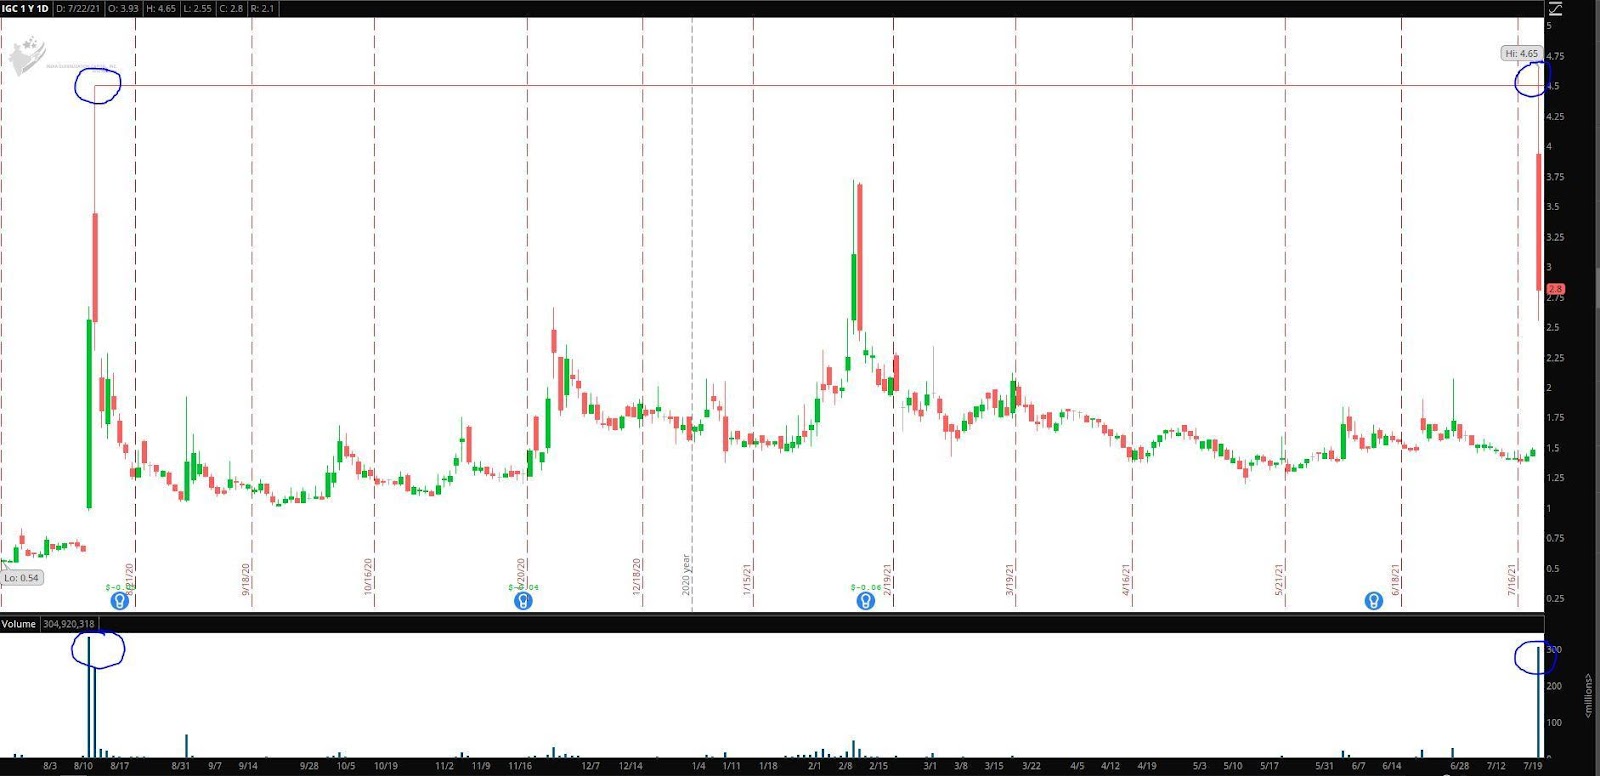
Well, first of all, let’s look a little further to the left! By left, I mean let’s look further left on the stocks chart!

The last time IGC traded, abnormal volume peaked at $4.50 and traded 247m shares in volume!
Yesterday, IGC topped out at $4.65 and traded 300m shares. Almost identical. That is no coincidence.
So the first step is understanding the stocks key resistance levels. Yesterday morning I identified the $4.50 area as a key resistance area. I said that as long as the stock was below this level it was guilty until proven innocent!
IF the stock had held above this area, then I would have been thinking about a potential long. But the stock failed to do so and quickly failed when testing these prices. Why? Many people who are still long from those prices took this opportunity to sell in my opinion.
But could there be another reason?
Ever heard of an ATM? I’m not talking about the machine that dispenses money, but rather an At The Market offering. Well I guess it is sort of like a machine that dispenses money, however in this case the company keeps all the money and the traders going long likely lose theirs.
Well IGC had in effect, an At The Market offering filed on 2021 – 01 – 13.

See the above screenshot, from their 424b5 prospectus filed.
This means that the company can sell up to $75m worth of stock on the open market.
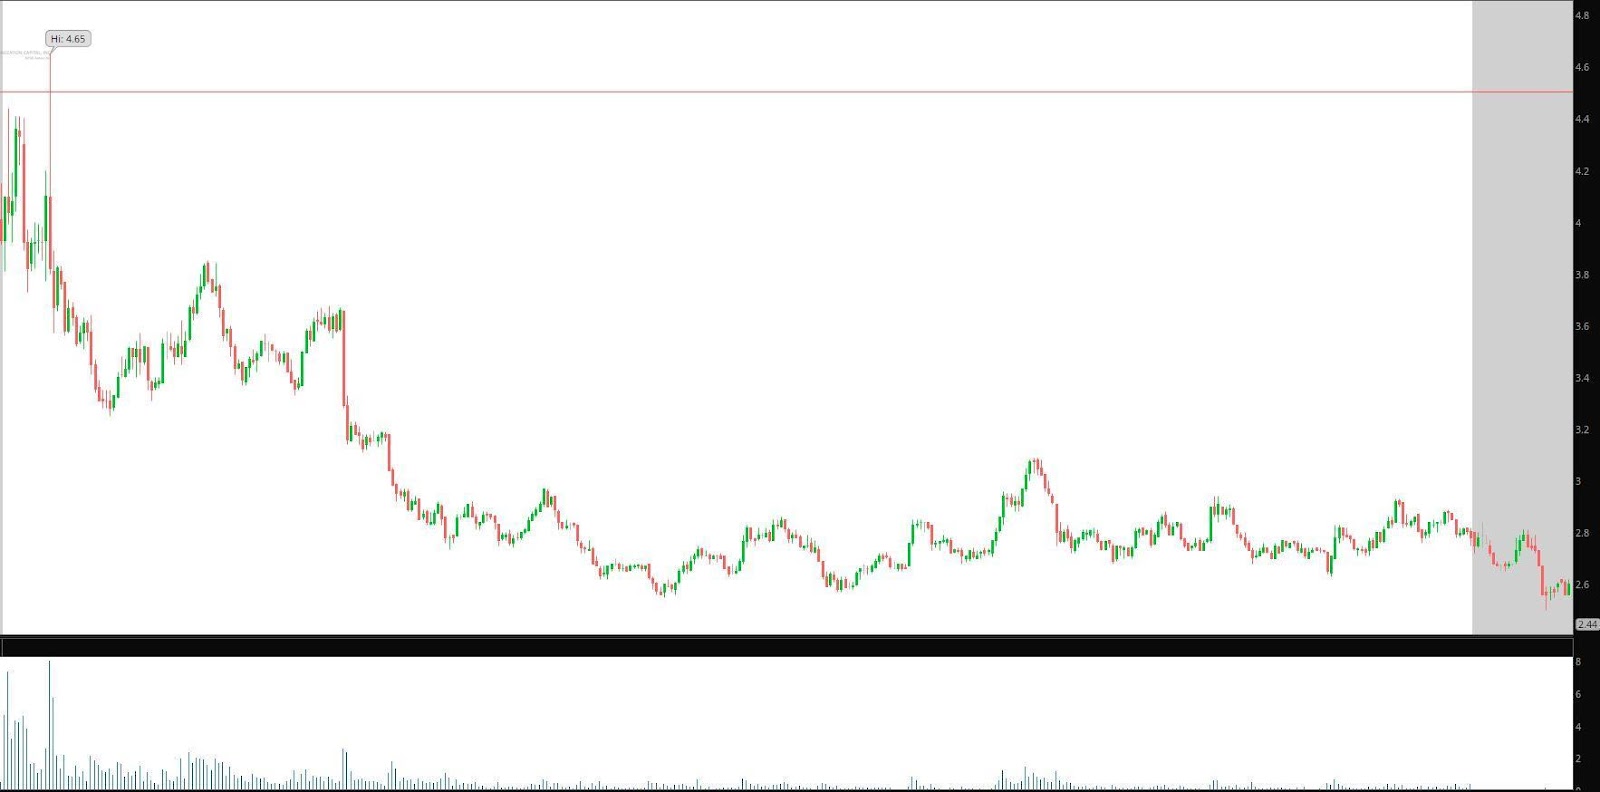
Lastly, try to draw the levels of resistance on your intraday chart.

As you can see shortly after IGC opened for trading yesterday it shot up to the $4.50 high time frame resistance area and IMMEDIATELY failed (we call this a stuff setup), and then proceeded to sell off the entire day.
Bottom Line
A simple rule of thumb that could either help you avoid headaches on the long side or, who knows, even be ready for an opportunity on the short side is always to have your key resistance levels drawn on your charts!
Comments are closed.


1 Comments
Thanx Jason and your team