Trading patterns are at the core of my decision-making process.
While these patterns allow me to frame a trading idea in terms of a potential price target vs. defined risk, it’s not always easy to stay in a trade without getting stopped out by an unexpected increase in volatility or falling victim to one of the many different algorithmic programs that now exist.
There are, however, several methods that traders can employ to help prevent getting shaken out of a trade prematurely.
Whether your goal is to protect a winning trade or to establish risk parameters upon entering a new trade, there are a host of technical charting tools that traders have at their disposal.
Quite honestly, there are too many methods to list in this article alone.
So let’s use this opportunity to discuss how traders can combine two popular charting methods to establish stops that are both fortified and absolute.
Back to Basics – Use price to establish protective stops
When it comes to technical analysis, price is the ultimate arbiter.
Therefore, knowing how to identify key price levels can often give traders the edge they need when trying to stay involved in a trade without being force out prematurely.
If you’re familiar with my market commentaries and trade idea discussions, you know that having a plan in place prior to committing capital to a trade is of the utmost importance.
Perhaps the most important part of that plan has to do with the trader establishing the reason for entering the trade in the first place.
There are countless reasons why a trader might decide to enter a trade.
Maybe the trade was placed to take advantage of earnings-related volatility or maybe the trade is a pattern-related trade.
Whatever the reason, a trader must understand the limits beyond which their trade is no longer working in their favor.
For today’s discussion, let’s simply assume that a trader has entered a trade to capitalize on a rising price trend.
In this particular case, the trader must have some familiarity regarding the rules of an uptrend.
For instance, for an uptrend to remain in force the stock price is not allowed to violate the most recent swing/pivot low, since such a development would alter the trajectory of that trend from up to sideways/lower.
Armed with this information, the trader can then place his or her protective stop where it counts the most, just beneath the most recent swing/pivot low. Let’s look an example.
Infrastructure has been a hot topic of late, given the Biden administration’s recent plans to unleash historic levels of infrastructure spending on the economy.
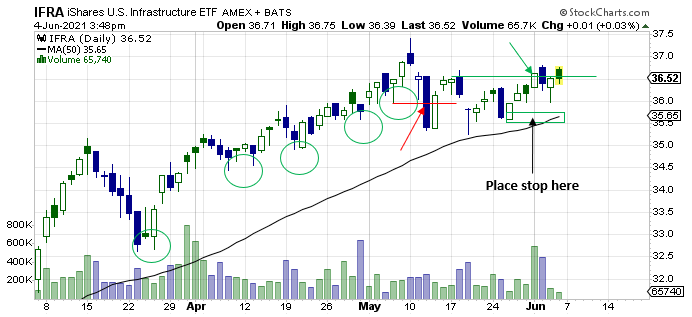
The chart below shows a daily chart of the IShares US Infrastructure ETF (IFRA).

The circles represent the swing/pivot lows that develop as a higher price trend takes shape.
As noted earlier, because of the rules of trend development, a trader can maintain a position in the direction of the trend until a violation of the most recent swing/pivot area occurs.
In this example, such a violation occurred on 05/12 (see red arrow), when price collapsed below the 05/06 swing low.
Once a trend has been broken like it was on 05/12, the trend simply transitions laterally until either a new trend of higher highs and higher lows begins a new uptrend (see green arrow), or a series of lower highs and lower lows forms a new downtrend.
Multiple support levels lend confidence to bullish trade ideas
When it comes to setting stops, like many things in life it is beneficial to have supporting forms of evidence to help lend credence to our decision.
While it is not required to have these supporting forms of evidence, it is common for traders to favor setups where a recent swing/pivot low also has a popular moving average and trend line in its vicinity.
In the case of IFRA, the popular 50-day moving average happens to line up with the newly developed swing/pivot low that was recently established on 05/26.
The combination of price and smoothing (moving averages are known as smoothing lines) support that now exists in the area of the 05/26 swing/pivot low at $35.60 (see green rectangle) helps to fortify this area’s importance.
Ultimately, this reaffirms the fact that, if price were to fall below this area, the higher trend that the trader based his original trade entry upon would become void.
Knowing that the 05/26 swing/pivot low at $35.60 is absolute, the trader can then place a protective stop just below that level to prevent getting shaken out of the long trade prematurely.


