
Do you like puzzles? Yeah, me too.
You may not realize it, but to be a successful options trader, you must learn how to solve a puzzle that consists of three key pieces:
- Time
- Magnitude
- Volatility
Let’s break each piece down one by one, then highlight a bread and butter pattern useful in solving this puzzle.
Time
First of all, it’s essential to understand what makes up the price of an option. Without getting too bogged down in the complex mathematical formula at the core of options pricing, let’s think about options pricing in terms of the following:
- Intrinsic value
- Time and Probability.
Especially in the beginning stages of their trading, far too many traders lose money because they do not fully understand the concept of time decay, otherwise known as theta.
For example, just because a stock is trending higher does not mean that a trader should automatically buy calls. If, for instance, calls are purchased after an aggressive price rally, when conditions have become overbought, the potential for price to then begin to correct lower over a multi-day period increases.
If a trader has not purchased a call option with enough time to absorb the time decay— it eats away at the value of the option during a downside correction in price. The odds that that call option will expire worthless increase greatly.
Therefore, understanding how much time will be required for the price to move enough for your position to move your way, is something that takes some time to master.
Magnitude
When we use the word magnitude during a discussion on options, we’re talking about the distance price can potentially travel.
In addition to helping traders solve the time element of options trading, this is where price pattern analysis becomes helpful.
Price patterns help us understand where possible price targets may be at a future point in time after a breakout of that pattern.
Again, let’s use the uptrend example we discussed earlier. Just because a stock is in an uptrend does not provide a discretionary method of setting a price target. All it tells you is the direction in which the price is heading.
If that stock is trending higher within an up-channel, the channel “pattern” allows a trader to speculate that the top-end of that channel is a potential target.
Channels are one of the many price patterns that can be used to generate possible price targets with better than average odds.
Other popular patterns amongst technical traders are head-and-shoulders tops and bottoms, double tops and bottoms, wedges, flags, pennants and the list goes on.
Therefore, it behooves options traders to take the time not just to learn these patterns but to spend time practicing identifying these patterns in real-world situations.
Volatility
Volatility is the range of price change a stock experiences over a given period.
If the market maker expects that the underlying stock will increase in volatility, they raise the price of time to keep their expected winning percentage at 70%. Conversely, they’ll reduce what they charge for time during periods of lower volatility.
For today’s lesson, all you need to understand is that when volatility is high it causes options premiums to swell. Under these conditions, we want to be selling options.
Conversely, when volatility is low and options premiums are cheap, we want to be buying options.
Putting it all together with Flags & Pennants
Think about it. If we could find a pattern that helps fight time decay, provides a clear price target and typically coincides with an expansion in volatility from low to high levels, it would provide very useful insights.
As it turns out, there are two such patterns, and they are known as Flags and Pennants.
Flag & Pennant Patterns
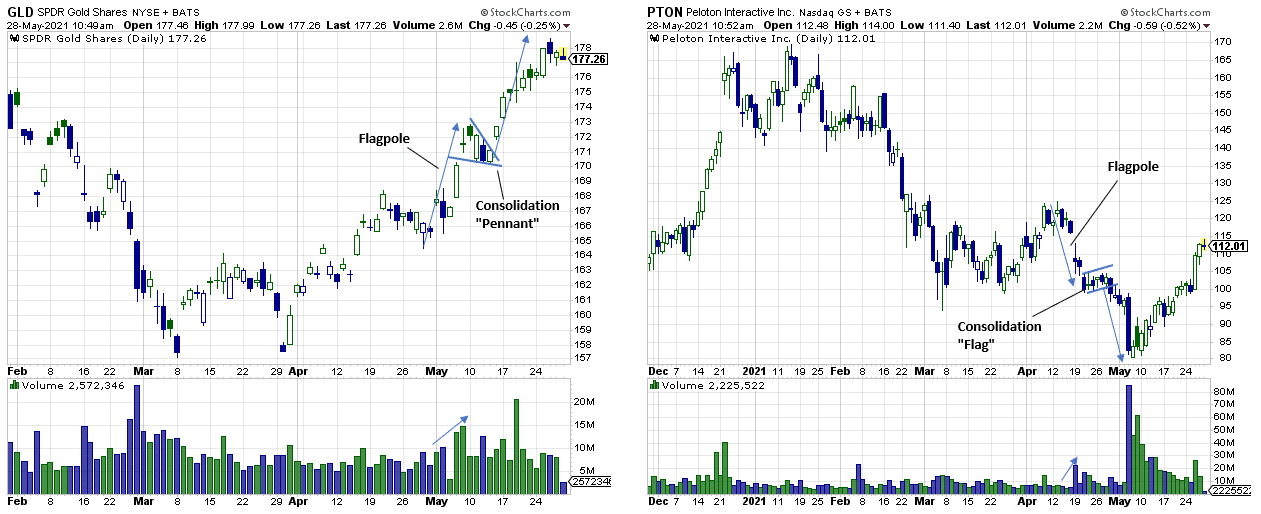
Flags and Pennants are short-term continuation patterns that mark a brief pause before the previous trend resumes. These patterns are usually preceded by a sharp advance or decline with heavy volume, and are found at the midpoint of the move.
The chart below shows two examples.
To be a successful trader, you must always enter a trade with some form of a plan or thesis.
For example, if you decided to enter a trade because of a signal that was being projected by a pattern at the time, you must respect the rules of how that pattern is supported to develop, and know the parameters that make up a successful pattern scenario.
When it comes to Flags and Pennants, this is one aspect that is rarely discussed.
Specifically, the very specific rules behind Flags and Pennants help a trader understand the following:
- How long it should take for the consolidation portion of the pattern to develop
- What the limits of the pattern should look like
- Whether or not the move out of the consolidation portion is developing fast enough
A sample trade would look something like this:
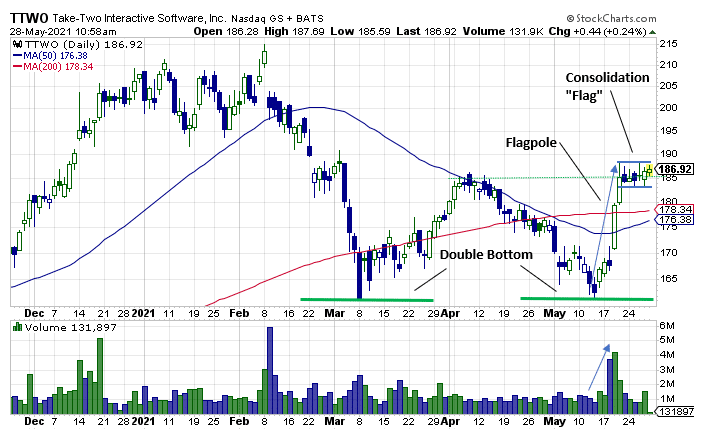
Take Two Interactive (TTWO) shows a current example of a developing Flag Pattern.
In fact, this pattern is made even more interesting as it is developing right on top of the recent breakout point of a large double bottom pattern.
A trader can either enter the trade now as the Flag (consolidation) portion of the pattern is still developing or the trader can wait for confirmation of a breakout.
If entering during the consolidation phase
If the trader enters the trade while the consolidation portion of a flag is still developing, the trader is armed with the knowledge that the ideal amount of time that the consolidation portion of these patterns should take to develop is no longer than 4 weeks (though they can take up to as long as 8 weeks to develop).
If entering after a breakout
If the trader waits to enter the trade after the breakout, then they know 3 important pieces of information.
First, they know the potential magnitude of the coming move (i.e., the potential target). That target is simply the height of the flagpole leading into the consolidation phase projected higher from the point of breakout (see examples on charts above).
Next, the trader knows the move out of the pattern should be aggressive, with little hesitation along the way to the target.
Lastly, after the breakout occurs, the trader knows that the move toward the target price should take roughly the same amount of time that it took for the flagpole to develop.
Bottom line
The rapid nature of the move out of Flags and Pennants, the ideal amount of time that the consolidation phase should take to develop and the fact that volatility tends to decrease during the consolidation phase then explode higher after breakout provides a trader with the following insights:
- If the flagpole took 1 week to develop, the trader knows that they likely do not need to buy expensive options far out in time, because the move out of the consolidation phase should only take roughly one week.
- Since the move out of the consolidation phase of the pattern should happen quickly, travel a far distance, and cause volatility to increase, the trader knows that this will fight time decay and influence options premiums to expand rapidly, allowing them to purchase options further out of the money.


