

It’s a market phenomenon that dates back to the early days of trading and to this day remains one of the more difficult concepts for many new traders to grasp.
“Buy the rumor, sell the news” is an age-old mantra that has left countless traders holding the bag. The emotion often leads novice traders to ignore the mean reversion forces that usually cause a stock to fall after anticipated news has been announced.
If you think about it, when a company’s stock price rallies on expectations of a corporate development that promises to strengthen the company’s financials well into the future, it can seem counterintuitive to sell the stock when the news becomes official.
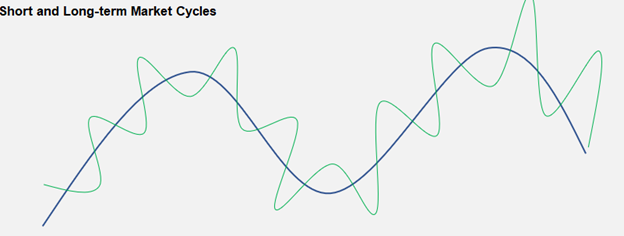
As traders, we must respect the fact that stock prices move cyclically, overshooting some central mean to the upside and downside as a long-term price trend develops, in a manner that resembles something similar to what’s shown on Figure 1 below.
Figure 1
Whether it be the anticipation of strong sector-wide earnings, a beneficial change in government policy, a stock-friendly decline in interest rates, or the rumor of some new revenue-generating business line, there’s no shortage of fundamental narratives that cause these shorter-term overshoot cycles to develop.
The key thing to be able to recognize as a trader is when these cycles have run their course.
I’m about to show you how to identify when a rumor-driven price rally may have run its course to the point where, at a minimum, placement of high-probability time decay (theta decay) trades should be considered.
Traders “sell the news” of Virgin Galactic’s historic first space tourism flight
On July 11th, Virgin Galactic (SPCE) completed the world’s first space tourism flight.
But the company’s stock plummeted nearly 40% in the wake of that event this past week, as the achievement of this highly anticipated goal caused the mean reversion process that actually began 2 weeks earlier to accelerate.
As traders, we must learn to control our emotions, and part of that learning process includes not chasing stocks when they’ve moved too far from the mean.
Traders are equipped with statistical tools like Bollinger Bands to help them gauge when a stock’s price has moved too far, too fast, thereby increasing the potential for the stock to correct back toward the mean.
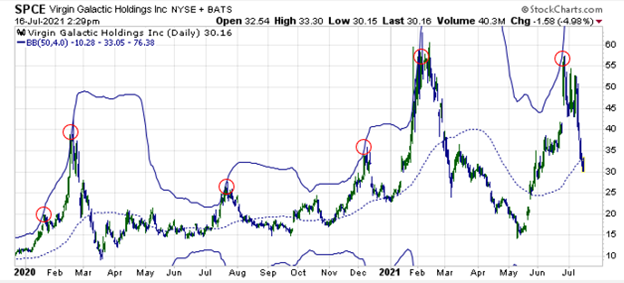
As Figure 2 below shows, this was the case in late June for SPCE, when the stock surged 4 standard deviations above the 50-day moving average.
Now, you’re probably wondering why I chose a 50-day moving average and +/- 4 standard deviation bands vs. the default Bollinger Band settings of 20-day moving average and +/- 2 standard deviations.
First of all, it’s because I am trying to capture longer-term cycles, and the 50-day line allows for more upside expansion than the default 20-day line.
Secondly, it’s because every stock has what can be considered its own fingerprint, which is to say that every stock tends to move with its own volatility characteristics.
As Figure 2 below reveals, since the early part of 2020, which is when the stock really started to become active, SPCE’s strong up-cycles have always stretched up to around 4 standard deviations above the 50-day line before some degree of mean reversion starts to take effect (see red circles).
Fast forward to the most recent cycle that topped on 06/25, we can see once again that this was the starting point for the latest correction.
Figure 2
Make no mistake; hindsight is always 20/20, and for anyone to say that it would have been easy to pick the top as the stock was surging to multi-month highs on 06/25 would be kidding themselves.
Taking bets against the prevailing trend is hard.
That’s why we must learn to develop the patience necessary to wait for a number of factors to come together in a way that creates a higher probability setup, and part of that higher probability setup includes the use of one of the highest probability options trades.
I’m talking about a vertical credit spread.
How the recent “sell the rumor” setup favored the use of a bear call spread
Vertical spreads are favored by many options traders for a number of reasons.
First, they benefit from the passage of time.
Next, they are profitable if the price moves in the trader’s favored direction, sideways, or even if the stock moves a little bit against the trader’s favored direction.
Finally, they offer defined risk.
The maximum gain that can be earned from a credit spread is the net credit, realized when both options expire out of the money.
The maximum loss potential is the difference in strike prices – net credit. Realized when both options expire in the money.
Now, while it is true that a trader is limiting his or herself in terms of potential profitability, given that the maximum profit that can be made is the credit received from creating the spread, these trades offer a much greater probability of success, since the selling of spreads makes the passage of time an options trader’s friend.
In the case of SPCE, I alerted readers to the $50 / $55 bear call spread this past Monday morning, with expectations of the stock entering a cool off period as the “fast money” leaves the stock in the wake of the historic first tourism space flight on 07/11.
Now, at the time, there was no indication that the price of SPCE was going to collapse as hard as it did.
Remember, hindsight is 20/20.
However, there was enough evidence to speculate that the bullishness that caused SPCE to rally 4 standard deviations above its 50-DMA had become exhausted, and that, at a minimum, a meaningful degree of upward price deceleration should follow.
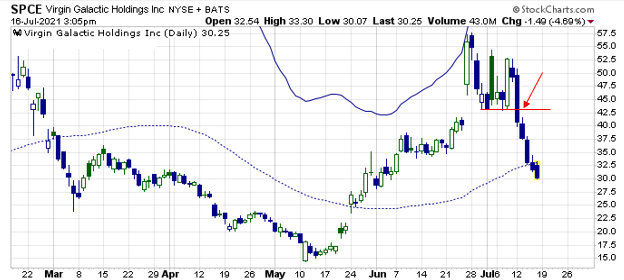
As figure 3 below uncovers, that evidence grew even stronger on Monday, when SPCE confirmed a small top by closing below the bottom of the post-06/25 distribution range (see red arrow on the chart below).
Figure 3
Bottom Line
Placing trades that bet against a strong trend (i.e., countertrend or mean reversion trading) is not easy, especially in the early stages of learning to trade.
That’s why it’s often beneficial to use higher probability options strategies like credit spreads to express your countered view in these situations, rather than straight puts (when you’re feeling bearish) or straight calls (when you’re feeling bullish).
Even when a trend appears to be stalling, as was the case with SPCE this past Monday, in real-time when markets are moving it still takes skill to be able to build a countertrend position without suffering too much pain in the early stages.
Therefore, learning how to take an initial overbought signal like the extreme 4 standard deviation move discussed earlier and combining that with a trend reversal signal like the range breakdown shown on figure 3 is an important step in learning how to better time higher probability entry points.


7 Comments
Understood
I get lost by spreads, i do calls and puts, not easy
I use credit spreads regularly, especially with SPY, and QQQ.
These are overnight trades, expiring the following day. There seems to be little downside to this tactic, while realizing my gain[s] are limited.
22% of something is better than 100% of …..
I always learn something from your great articles! Thank you! KD
Its like you read my mind! You appear to know a lot about this, like you wrote the book
in it or something. I think that you can do with a few pics to drive the
message home a bit, but other than that, this is wonderful blog.
An excellent read. I will definitely be back.
This is one awesome blog post.Really looking forward to read more. Really Great.
I loved your article.Thanks Again. Great.