
Hello traders and welcome to another lesson on one of my favorite indicators to use when looking for potential entry and exits; Bollinger Bands.
Jeff Williams here and today I spotted one of the biggest movers on all of Wall Street, ENJY.
Not only was this one of the biggest movers today, but it was also one of the biggest dollar volume movers on stocks under $1.
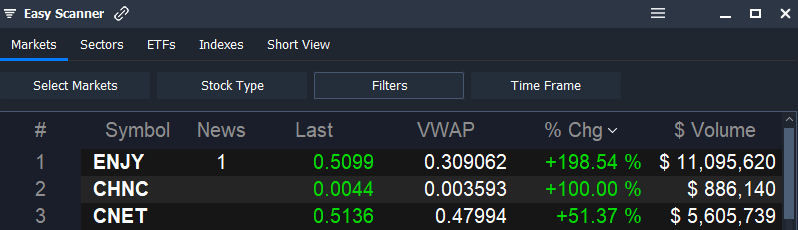
Most people think I trade low-float stocks with small volume, which is not at all what I am looking for. As a matter of fact, I am usually looking for stocks with at least a million dollars of liquidity.
Being a teacher for 12 years, I love sharing the knowledge of WHY I got into a trade, so today’s lesson will focus on Bollinger Bands and patience.
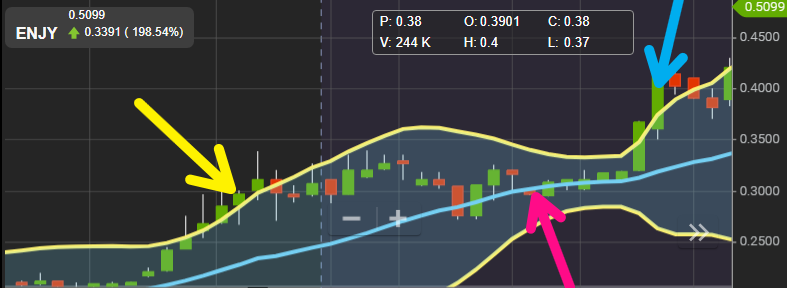
In the first image below, you’ll see how ENJY spiked quickly on solid volume (first big green candle on the left side), I actually missed that first spike because there was no reason to have ENJY on my radar prior to that. What happened next was a picture-perfect bounce off the middle Bollinger band.
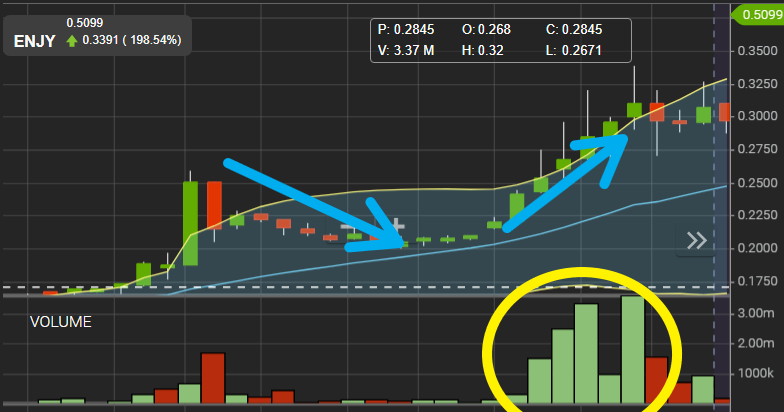
You see, Bollinger bands measure volatility and they can be great tools to help guide me in an entry or an exit, in this case, it was the entry.
After ENJY spiked, grabbing my attention, I was patient and waited for the price per share to pull back to the middle blue line; see that blue arrow above on the left pointing right at the middle blue line, that’s the middle Bollinger band or also the 20 SMA. This is where I set my buy and I broke down all this action LIVE on the microphone via our chat room for other members to learn from as well.
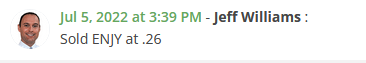
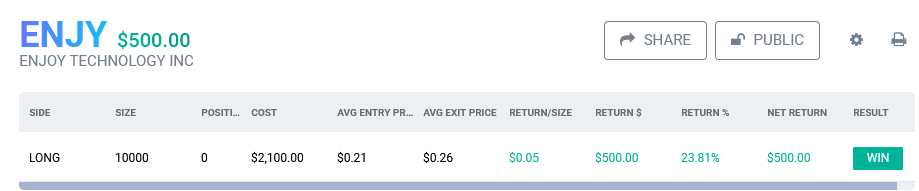
I entered the stock at $.2097 off the blue line and then sold the first big spike higher. Check out the BIG VOLUME spike circled in yellow. Perfect timing, right to the top of the Bollinger band at $.26.

See, according to the Bollinger bands, if the price per share spikes ABOVE the top Bollinger band (yellow thin line above) they say to watch for a pullback in price which you can see above shown by the blue arrow on the right. Notice that small pullback in price right after breaking above that top Bollinger band. I sold just before that, as the price per share spiked above that top band as I felt a pullback was looming.
I wasn’t done just yet!
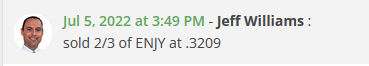
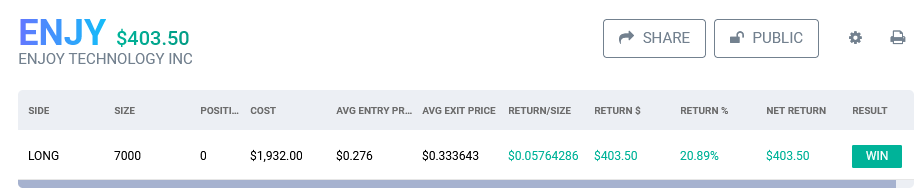
I waited for the next setup and bought back in at $.276 as the price per share started to rise again. I sold ⅔ of my shares at $.309 into the next spike, then held the rest into after-hours where you can see below how the price per share bounced off the middle Bollinger band (pink arrow) and then back up HIGHER where I sold my last ⅓ at $.378.


This is a great example of how I spotted a stock with a volume surge and price per share spike, waited for the pullback, bought off the Bollinger band, sold into the next spike, then rinse repeat.
This really made my day and I was happy to teach this lesson live to members as I was executing this trade.
Had I not had the Bollinger bands on my chart I might have missed this entire setup.
I hope you enjoyed this lesson and if you don’t use Bollinger bands, then you may want to consider paper trading them for a while to see if you like how they react to stocks you’re watching as well.


