

You may not realize it, but being a successful trader is a lot like being an effective sniper.
Both traders and snipers must constantly monitor certain variables that can affect their success rates.
Snipers analyze weather, heart rhythm, trajectory, camouflage, and rifle recoil, while a trader must pay attention to trend, trend strength, momentum, mean displacement, and relative performance.
Today, I am going to show you a 3-step approach that I use to myself in a sniper-like mindsey when timing my swing trade entries. In addition, I’m going to use this method to find an actionable trade idea for the upcoming week.
Trend-based trading systems are very effective
During your journey to becoming the best trader that you can be, you’ve probably come across some outlandish claims when it comes to the success rates of some trading strategies.
Remember, if trading were easy, everyone would be driving Lambos and “making it rain.”
In reality, trading is not easy.
Anyone that tells you otherwise is full of you know what!
It is well documented that the biggest obstacle to becoming a successful trader is the battle that we often have with ourselves.
It can often take years to master how to overcome fear and greed.
You have to start somewhere, though, and a good place to start is to start placing trades using the simple trend following method we’re going to discuss next.
The folks that succeed in this business almost always follow these same simple steps:
- Trade with the trend
- Keep losses small
- Let winners run
Trading with the trend is really quite simple, since it only requires that we buy stocks that are above rising moving averages (the settings for those moving averages depends on your style of trading, i.e., long-term vs. short-term) and sell stocks that are below falling moving averages.
The problem often arises when greed gets the best of us, and we wind up trading against the trend.
Why would anyone want to trade against the trend?
Most of the time it’s because price cycles that go against the trend (i.e., countertrend moves) usually cover a lot of ground in a short period of time.
While such trades offer the potential for tremendous profit in a short period of time, the odds of success are far less than when we trade with the trend.
Use Stochastics to become a better market timer
The stochastic momentum indicator was developed by George C. Lane in the late 1950s, and this indicator has remained a go-to timing tool for many traders ever since.
The Stochastic indicator is a momentum indicator that helps you identify overbought and oversold market conditions within a trend, and is readily available on most trading platforms.
This indicator is an oscillator that moves in a fixed range of 0 to 100.
By default, readings above the 80 line are considered overbought, while anything below 20 is considered to be oversold.
The math behind this indicator is rather complex, and while you probably do not need to understand the formula, it is important to understand its inner workings.
For a more detailed discussion on this topic, please click here.
Like so many other oscillators, just because a security has become overbought or oversold does not automatically mean that it’s time to “pull the trigger.”
The method I am about to show you is a simple, yet powerful way to optimize this oscillator, so that you know when your best odds of success exist.
Use trend and trend strength to determine when Stochastic signals can be trusted
By no means is what I am about to show you the only way to use Stochastics.
Instead, this method is one of the more widely used approaches taken by traders who use stochastics as a timing tool, because of its success rate.
Like many things in trading, one indicator’s signal is fortified when taken in conjunction with supportive signals from other indicators.
For this simple trading method, we’re looking for any important moving average to provide support and a sense of trend direction, the RSI momentum indicator as an indication of trend strength, and the Stochastic indicator as a means for timing the trade entry.
Let’s put it all together on a stock that just witnessed a swing trade entry signal.
Figure 2
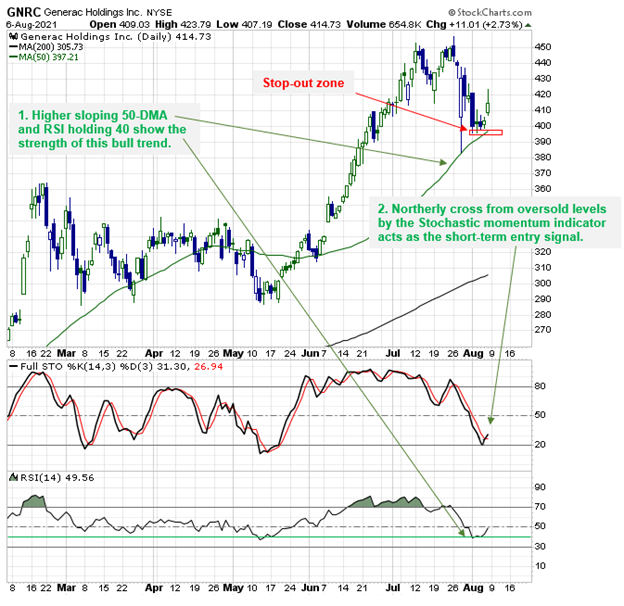
First, the chart above shows the trade setup starting with the stock pulling back to the popular 50-day moving average, which is rising (this gives us bullish trend direction and support).
Next, the RSI momentum indicator confirms that, when price was testing the rising moving average support line earlier this week, trend strength was strong, with RSI holding above the 40 level.
Teachable moment: When an uptrend is in progress, any price pullbacks that are accompanied by RSI holding above the 40 level are considered by many to be healthy pullbacks within a strong uptrend. This is because the 40 level is considered the bottom of RSI’s bullish range.
Finally, the trade entry signal occurred when the faster of the 2 Stochastic lines (the black %D line) crossed above the slower Stochastic line (the red %K line), after the faster %D line touched the oversold 20 level earlier in the week.
To clarify, for a Stochastic buy signal to occur as part of this system, the faster %D line must either touch or dip below the oversold 20 level before crossing above the slower %K line.
In summary, price falling back down to and holding support at a rising 50-day moving average with the RSI indicator never closing meaningfully below 40 both indicate that the prevailing trend is up and that the recent pullback was healthy (i.e., the long-term uptrend is still strong).
While this information does not guarantee that the bullish swing trade is going to work, it does offer statistical evidence that the odds of success are relatively elevated.
From there, the trader simply waits for bullish confirmation that an upside reversal is developing in the form of a bullish crossover in the Stochastic indicator from oversold levels, which occurred on Friday.
While shares of GNRC did see a large rally on Friday, indicating that a bit of a pause may occur before prices continue higher, a bullish trader looking to speculate on an eventual resumption of Friday’s rally now has a well-defined stop-out level to use in the $396.20 area, where the most recent pivot low and the 50-day moving average have joined forces.


4 Comments
Thanks, J! This is great! KD
It’s a good article and it helps me in some trading areas.
Thanks.
Thanks JB, that is a great discussion. I love how the traders are introducing so many different ways to apply useful indicators these days! Thank you 🙂
Thank You Jason. This was very helpful.
Sony