
Stocks don’t just go up and down…they also go sideways.
And while many traders scroll right past a sideways chart, I pay attention.
When we expend energy, we need rest before getting at it again. Well, it’s no different for stocks.
And this “resting phase” is a factor in what happens next.
The more rest, the more energy that can build up…
This is why the consolidation breakout is one of my “bread and butter” chart patterns.
And I’m going to walk you through the details now.
What is a Consolidation?
Consolidation happens when a stock needs a breather.
This is a resting phase where the stock can be seen trading in a range…often a tight range.
It’s both easy to spot and understand.
Just think about a simmering pot of water on the stove.
It’s quietly building up heat…
And once it does, the water will boil over.
Turn the knob down and the simmer stops, turn it up and it starts to boil over…
A consolidation is kind of like that.
The stock is taking a break while it builds up energy for the next move.
I am trying to grab this as it starts to boil… which is the break above the consolidation range.
Keep in mind that the next move can be in any direction. This is why I prefer to buy after it breaks out of the range on higher volume.
Importance of Volume
As with any setup, I’m also watching trading volume. I want to see light volume during the consolidation. This is the “resting phase” when the many players are making decisions and building positions.
And then I look for increased volume when the stock breaks out of the consolidation.
This shows me there is real demand behind the move and likely will have enough momentum for a decent target move.
And with the pressure build-up in the range, if the stock does break this level, it can lead to a significant change in supply and demand dynamics, with the top of the consolidation range often becoming a support level for a new move up.
Therefore I am using this level to plan my trade around.
The Consolidation Period
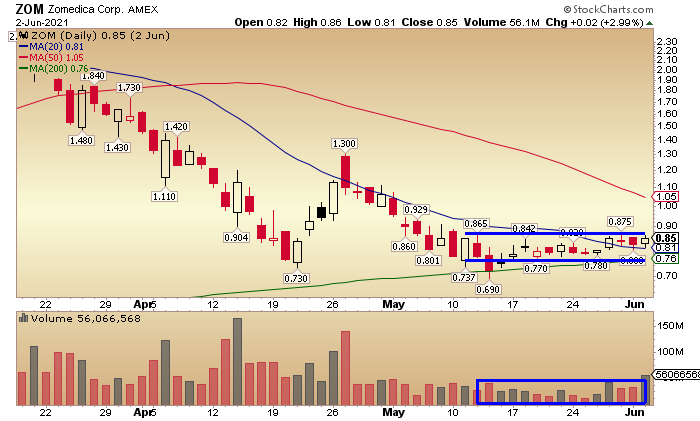
Take a look at ZOM for an example:
You see how the stock is in a downtrend and then levels out into a narrow trading range for weeks (marked by blue lines)?
This is the consolidation period/ resting phase… or “simmer time.”
How do I play this period?
I don’t… I simply wait.
Just because a stock is consolidating doesn’t mean it will break out, or do it any time soon.
Not to mention it could end up breaking out in the opposite direction.
This is a time that I like to practice patience.
I don’t even have to waste my time looking at it…yet. Although, I do like to pay attention to be prepared for a potential breakout.
The Breakout
This is one of my “bread and butter” trading patterns…(along with the Stair Step).
Take the concept of a consolidation or resting phase…and then add in a breakout. Now I’m on high alert.
Let’s go to the daily chart below…
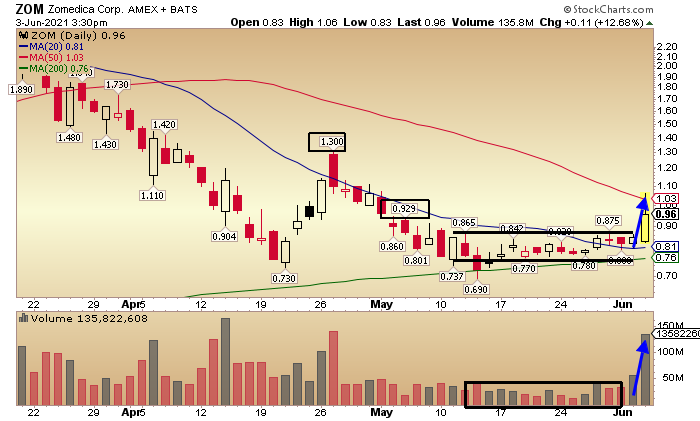
ZOM broke above the consolidation range… and volume was spiking up at the same time.
As mentioned above…
Volume is key in breakouts because it proves trader conviction in the move and helps push the momentum forward.
It also creates the liquidity I need to get in and out of the stock while it makes its move.
As you may know, I like to target the next resistance level on the chart. And in this case it was the 50 day MA line on the daily chart at 1.03 (red line in chart above).
While ZOM broke out making a move right up to the 50 MA, not every trade works out like this…so it’s important to really pay attention to what you are seeing.
Things to keep in mind are the strength of moving out of the consolidation, volume levels, and power of the movement into the close…
Hopefully, this helped you see the simplicity of a consolidation breakout…
For that reason it’s one of my “bread and butter patterns” that I use quite often (see also my Stair Step Pattern here).


4 Comments
Your ZOM chart was an excellent chart for this discussion. I liked your comment about Volume being the key in breakouts. It proves trader conviction & gives us the liquidity we need to get in & out of the stock.
Keep your lessons coming please. 🙂
This is great information, I can learn from you and
Jeff. Please tell me more.
Thank you,
Thank You for sharing this Jeff, I really appreciate it!
Keep it coming. I’m new to this….and it saves me alot of time.
Hi Jeff, Your stair step and consolidation into a breakout lessons are very helpful. Thank you.