
Today I’m going to share a quick lesson on how I use the MACD indicator in relation to stock price, and that’s through a concept called positive divergence.
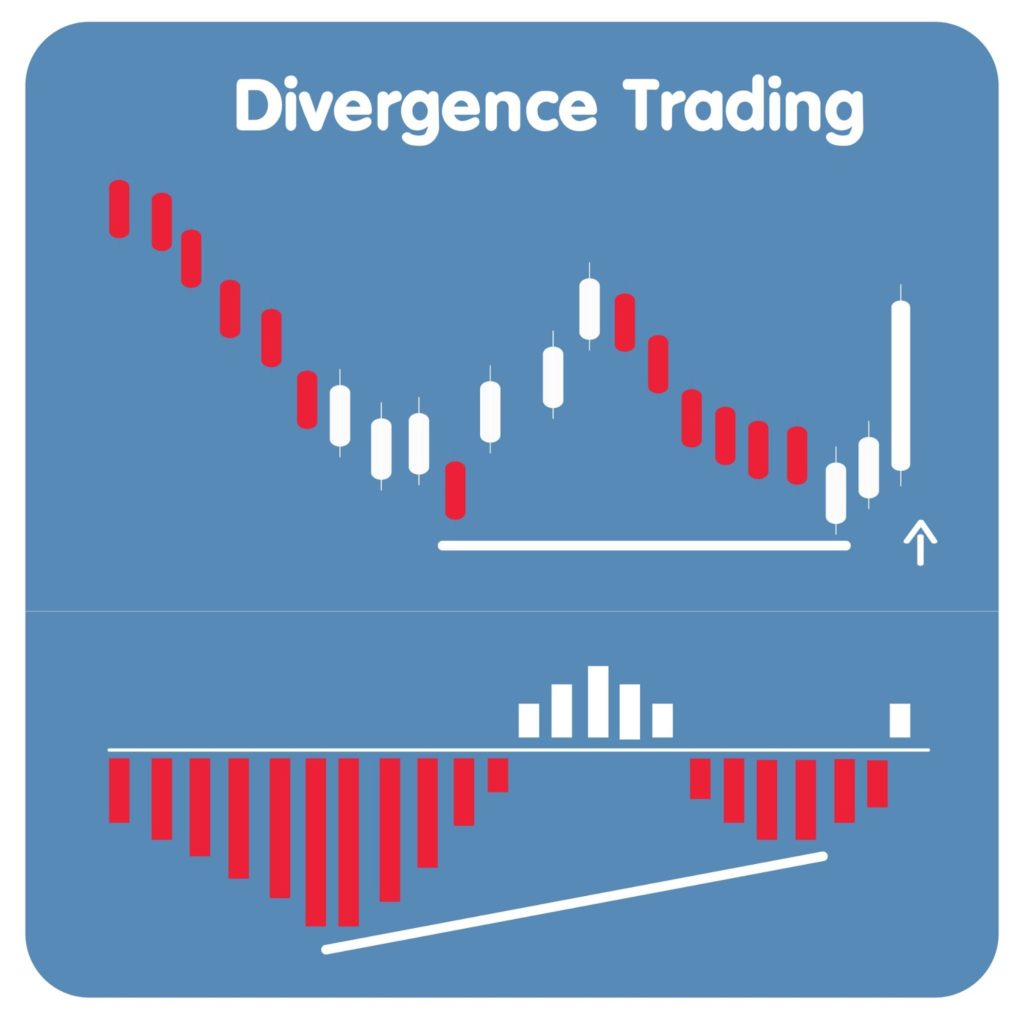
Positive divergence occurs when a stock makes a new low while an indicator makes a higher low… in other words, price is going down, while the indicator is going up (negative divergence is the opposite).
Divergence gives me an indication that the stock could be ready for a reversal/ change in trend, which leads me to the lesson for today.
Example of Positive Divergence
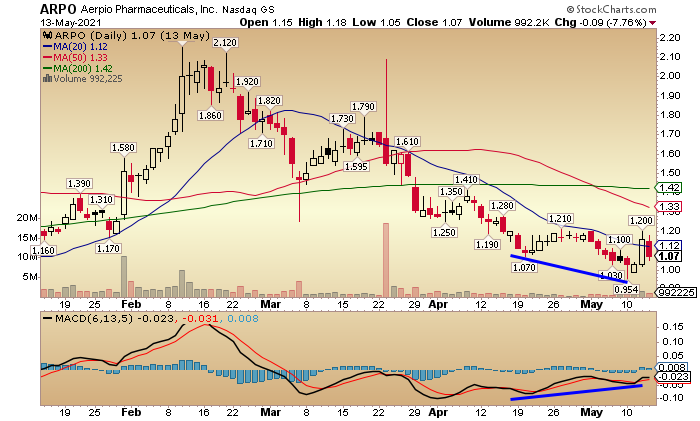
Look at the chart below. I drew blue lines on the chart to show the lower lows on the price chart and higher lows on the MACD line below it.
The price makes a new low while the MACD is already headed up. That’s positive divergence.
As mentioned, this is an indication that the stock’s current price trend could be losing steam and potentially ready for a change in direction.
If the trend was strong the indicator would still be going down as well, so when it diverges and points up while price is still going down…that’s considered an early warning sign that something may have changed.
It’s not a stand alone signal however, and should only be used as part of a whole.
I personally use it as extra conviction in a trade I am already looking at…or simply as an indication to take a closer look for a potential trade setup. If I don’t find an actual setup, I won’t trade the stock.
It’s a tool, not a system.
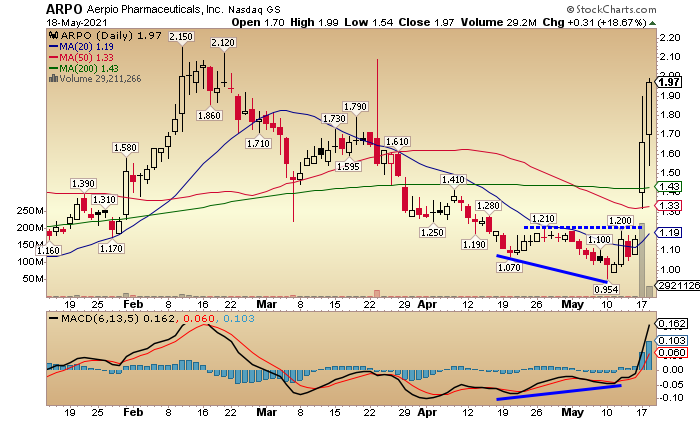
Here’s what happened after the positive divergence in ARPO…the stock traded up to resistance at 1.20 for a few days before gapping up to 1.40 and ripping to a high of 1.90 that day.
Now was there a trade here without relying on positive divergence alone?
You have to decide that for yourself based on your trading style, setups, risk/reward etc…
But I’ll show you one way to look at it…
Intraday Higher Highs/ Higher Lows
After the formation of positive divergence, the stock broke through resistance with a gap up…which made it impossible to simply “buy the break.”
Since that went out the window, another option was to simply buy the gap up, but I personally prefer to let things settle down after a move like that and find a good pattern setup…rather than chase the stock.
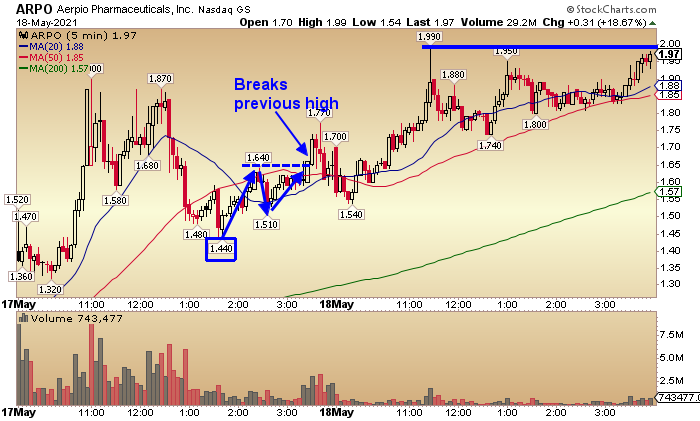
And here’s how I see it…after blasting up that morning, hitting highs at 1.90 and 1.87, ARPO pulled back to a low of 1.44.
Then the stock began a series of higher highs and higher lows, as seen on the 5 min chart below.
And this just happens to be one of my favorite patterns…learn more about that here.
If I was going to take this trade, I would have waited for the stock to make a new higher high, which happens when it breaks 1.64 towards the end of the day…
Volume picks up a little on the break, which is key in the higher high/ higher low breakout…or any breakout for that matter.
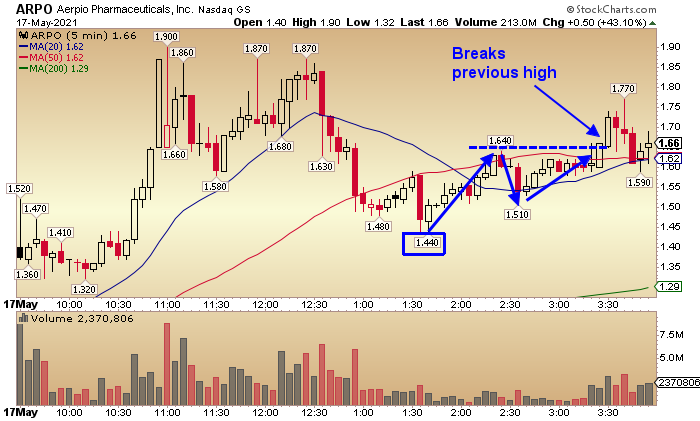
The next day, ARPO continued to make higher highs and higher lows, hitting resistance when it got back to the 1.90 – 2 range…as seen in the 5 minute chart below.
Would this be my exit?
Certainly could be as I like to get out just before resistance levels in order to beat the “rush to exit.”
Now…when it comes to using positive convergence, or any indicators, I don’t look at it as a stand alone trading signal.
I always stick to my personal trade setups and use it as extra conviction when it sets up alongside.
Concepts like this take time to get comfortable with, so it’s important to just pay attention and work to understand it better.


8 Comments
This is a very interesting concept…U want to test this/ Thanks again, I find these thoughts intriguing and doable,
Thank you Jeff!
Thanks
good lesson Jeff . It all helps
Very good lesson, thank you very much Jeff.
thank you
Thank you very much. Very well explained.
Thanks & hope your enjoying your 10 Year Anniversary 🙂