

As I have said before, when an opportunity arises, I make sure to take advantage of it!
This was the case yesterday when I identified one of my favorite intraday setups, the Consolidation Breakout Pattern.
As the setup was forming, I shared this trade idea with my members on the Trading Floor Mid-Day Watch List.
After recognizing the setup and significant risk: reward opportunity, l made a trade in HRAA after the stock broke out of the consolidation.
What is HRAA?
According to Yahoo, the company provides revenue cycle services for healthcare providers in the United States.
Market Cap: 26.9M
Average Volume: 2.19M
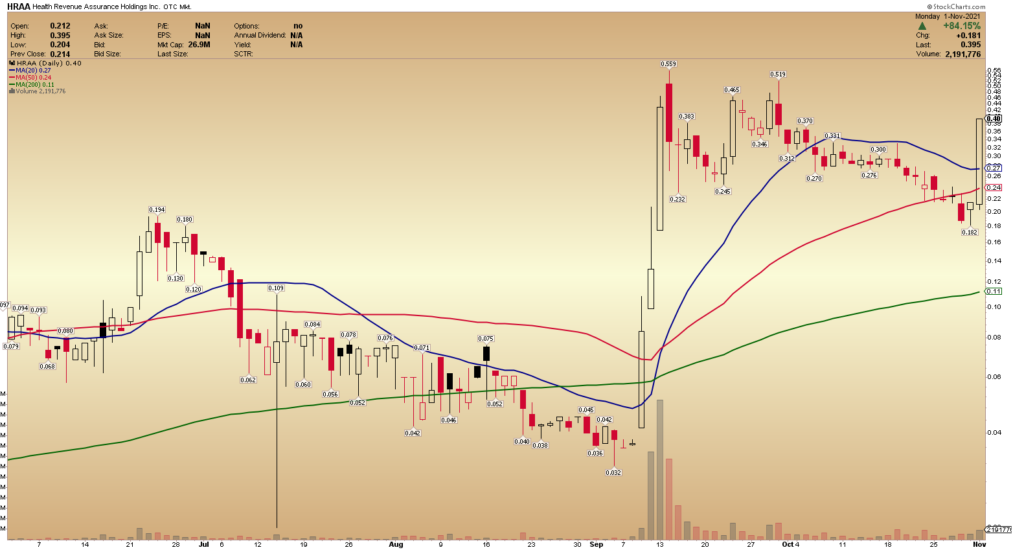
The stock has spent the last two months consolidating in a flag pattern. It’s rare, but in this case, the stock consolidated and broke out across multiple time-frames.
The stock was consolidating on both the intraday and daily chart. When I notice that my confidence and belief grow in the stock’s potential to gain momentum to the upside.
The Setup
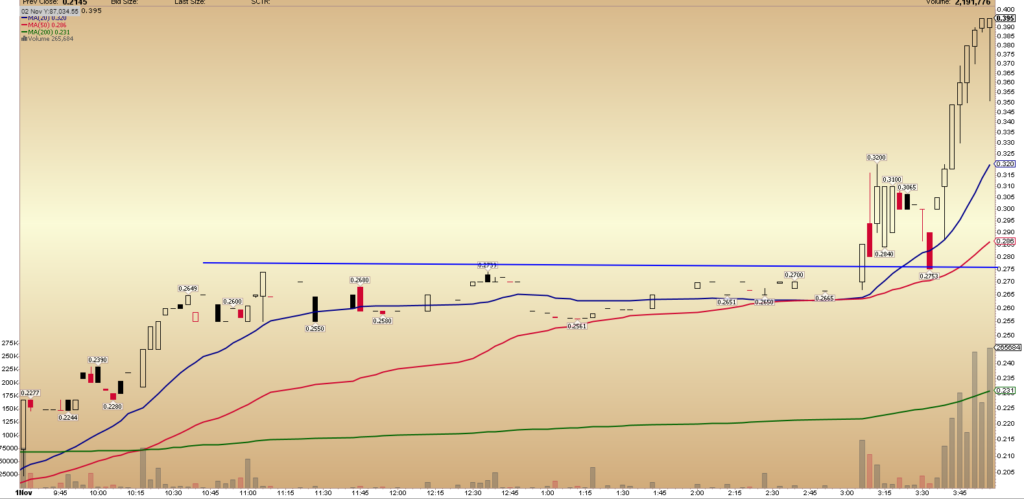
The stock spent the entire morning and most of the afternoon consolidating in a tight range between $0.27 and $0.26.
This consolidation presented a great opportunity.
As I mentioned in the Trading Floor Mid-Day Watch List, I liked the possible entry around the 20-day MA line break at $0.27, with a sell target of $0.30 to $0.33, previous highs, and potential resistance from the daily chart. My stop would be placed around the 50-day MA line at $0.23s.
My exact plan from the Watch List shared with members:

The Trade
After the stock broke out above $0.27, it experienced a sharp increase in volume and momentum to the upside.
The stock did exactly what I had planned. The stock broke above $0.27 and traded right into my target levels.
Based on the volume and range expansion, I entered the trade at a higher price than previously planned as I firmly believed the momentum would see the stock trade higher than I had initially thought.
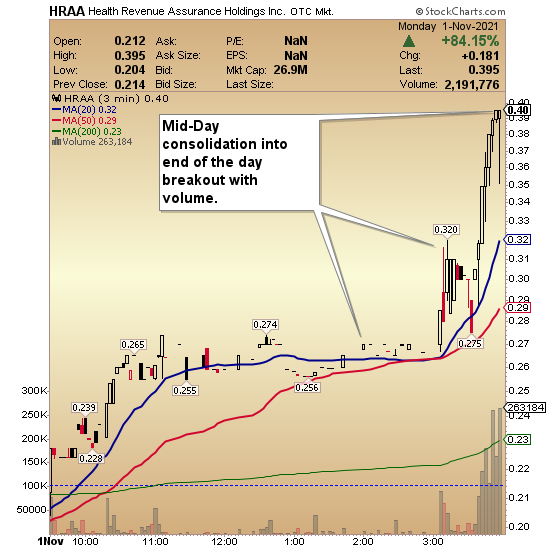
I got long at $0.319 after the stock broke out and held firmly above the breakout level. I then sold into the close at $0.39.
The Bottom Line
Many important factors were present and aligned for this breakout setup, making it a fantastic example of the consolidation breakout pattern.
The increase in volume was there, and the tight consolidation existed not only on the intraday but also on the higher time frame chart. The volume, momentum, and range all expanded on the breakout.
Of course, I don’t see the setup every day, especially as brilliantly formed as this one. However, when I do, I make sure to call it out to my members.
This is a setup that I repeatedly see in the market, and time and time again, it presents a great opportunity.


1 Comments
GREAT LESSON!