No matter what the market is doing lately, I’m always looking for a stock with some momentum to jump on.
But how do I know where to get out?
There are certain time frames and price levels I turn to…
And today I’m breaking it all down with trades in LTNC and PBYA.
I don’t just buy and hope.
Every time I take a trade, I do so with specific targets in mind.
Labor Smart Inc. (LTNC)
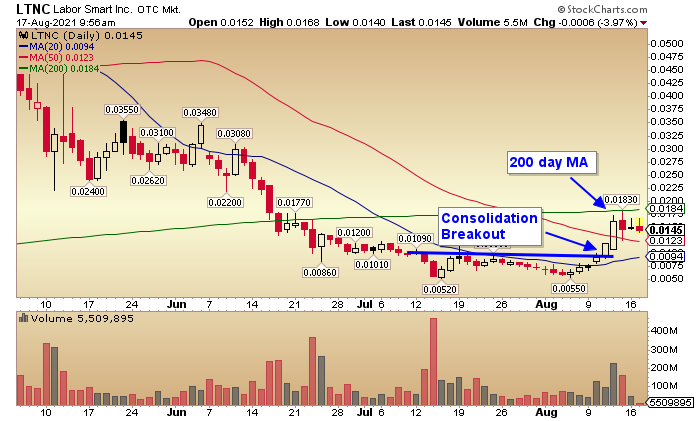
On the daily chart below you’ll find one of my favorite chart patterns…one I’m looking for every day…the consolidation into a breakout.
Once the stock breaks above the consolidation range, what happens next?
I’m looking for it to make a move to the next level of resistance on the chart…in this case, the 200-day moving average.

Here’s a look at the intraday chart for the same time period to give you a closer look at how I trade this setup.
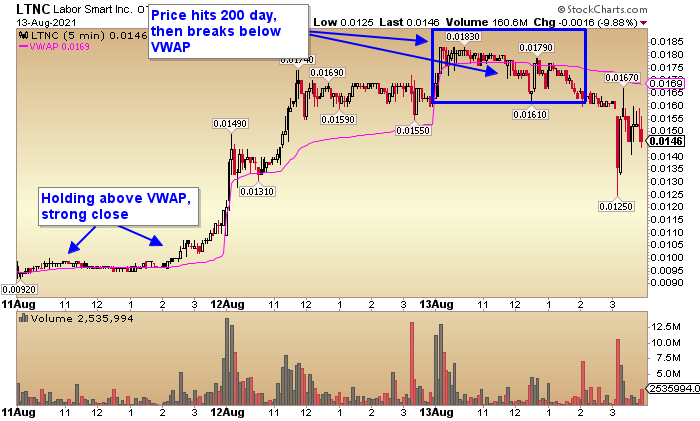
Below is the 5-minute intraday chart for 8/11 through 8/13:

The stock broke above the consolidation on 8/11 and held above the VWAP throughout the day before making a strong move into the close.
I bought the stock on the break at .0097 and exited the next morning at .0118.
Why so soon?
If you’ve been following me lately…I’ve noticed that a lot of penny stocks haven’t been following through the same way they were a few months ago.
To deal with that, my trading style has me in and out somewhat quickly so that I don’t get caught on the wrong side. After all, I can always get back in.
And that’s just what I did with LTNC.
I liked the stock as it stayed above VWAP and showed me strength on the close again, so I got back in at .0162.
And what did I do next?
Same thing as before…I sold the next morning as the price hit resistance at the 200-day MA.
I’m looking for patterns like these to get in momentum.
I’m also looking to limit my exposure to the market by getting out quickly, while the stock is still feeling that momentum.
Probility Media Corp. (PBYA)
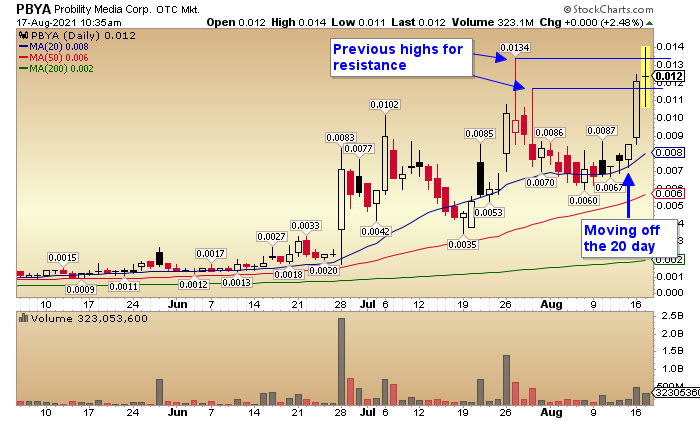
Looking at PBYA last Friday, I noticed the strength coming off the 20-day moving average on the daily chart.

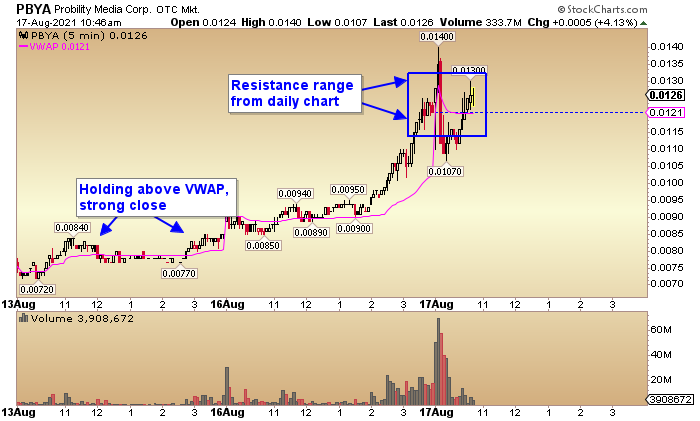
And moving to the 5-minute intraday chart below, PBYA looked a lot like LTNC.

Holding VWAP with a strong close on 8/13, I jumped in at .0083 and just like LTNC, I exited the next morning at .0092.
The stock traded below VWAP for a period in the morning before moving back above it and trading strong throughout the day.
Which is why I jumped back in at .01 as it broke above the mid-day highs. And again, I exited on a quick move up to resistance levels.
When I find stocks with good momentum, my plan is to get in AND out before it runs out of steam.
To do this I look for resistance levels, which could be a major moving average like the 200 day I used in LTNC…or previous highs like in PBYA.
To see more on the chart patterns I look for every day…check out the stair step pattern here…and the consolidation breakout here.


