
It’s very tempting to get comfortable with trading a certain asset class or sector.
For instance, traders might become comfortable with certain fundamental characteristics that a sector might exhibit, such as steady industry growth.
There are also technical characteristics that traders tend to become comfortable with, such as reliable trending action and stable volatility.
In the end, though, our goal as traders is to find good setups in a nutshell.
Think about it. If an active trader’s goal is simply to match the performance of the S&P 500 then he or she is working entirely too hard and probably should have simply bought an index fund.

I’m about to show you how savvy traders make allocation decisions favoring areas of the market that are expected to have good setups.
Moreover, this analysis bodes well for a stock I’ve been watching for a bit now.
That’s why traders that want to outperform the market simply can’t settle for being comfortable.
It takes a lot of research and analysis to find the opportunities that will allow you to find good positions.
One increasingly popular way to look for alpha and reduce risk is factor investing.
I’m about to show you how this week’s action delivered a major factor-based signal that should continue to deliver near-term opportunities.
What is factor investing?
Factor investing is a discipline that involves targeting specific drivers of excess returns across asset classes.
The goal of focusing on factors is to improve profitability, manage risk, and enhance diversification.
Investors who look for opportunities based on factors focus on things like value, size, quality, volatility and momentum.
Here’s some more detail…
Investors focusing on value look at stocks that have low prices relative to their fundamental value.
When it comes to size, investors would focus on the market capitalization of a stock.
For quality, investors simply look for quality stocks with low debt, stable earnings, consistent asset growth, and strong corporate governance.
Volatility investors look for stocks with low volatility, due to the abundance of evidence that suggests stocks with low volatility earn greater risk-adjusted returns than highly volatile assets.
Finally, when it comes to momentum, investors want to find stocks that have outperformed in the past and are posed to exhibit these characteristics going forward.
The opportunity that I now see developing comes from a combination of size and momentum.
Growth stocks have regained favor and are gathering relative momentum
One of the more popular narratives from the 4th quarter of last year through the 1st quarter of this year had to do with the shift in market leadership away from growth companies to value companies.
The reason this was such big news is because popular tech companies like Apple and Microsoft were among the growth companies that showed significant underperformance vs. the broader market during this period.
As inflationary pressures have eased in recent months, however, the decline in interest rates has helped boost the performance of growth companies.
You see, large growth stocks are valued based on future discounted cash flows, and many tech stocks have rapid growth assumptions built into them.
The higher rates go, the lower the present value of that future stream of earnings.
Therefore, if stocks are valued based on future discounted cash flows, and the discount rate is zero, then it doesn’t matter if investors see that money one month from now or 10 years from now.
When traders are hunting for leadership, a very common and easy way to find it is to perform relative strength ratio analysis.
At the most basic level, this means taking any tradable instrument and dividing it by its benchmark.
Most often, that benchmark is the S&P 500, and that’s what we’ll use for our purposes today.
The chart below shows the iShares Russell 1000 Growth ETF (IWF) divided by the SPDR S&P 500 ETF Trust (SPY).
As noted on the chart, when the ratio line is rising it means the instrument in the numerator position is outperforming the instrument in the denominator position.
Conversely, a falling ratio line means that the instrument in the numerator position is underperforming the instrument in the denominator position.
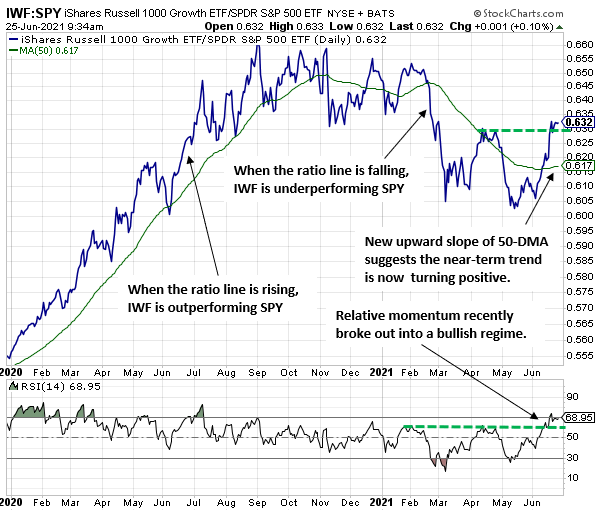
As the chart also shows, when looking at the relative performance of the largest growth companies that can be traded (i.e., the constituents of the IWF) against the benchmark S&P 500, there has been a bottom breakout in favor of IWF in recent days.
That’s right! Just like a regular price chart, traders can apply traditional pattern analysis to these ratio charts to identify opportunities.
In addition, traders can apply other indicators like moving averages and momentum to ratio charts.
When we combine the ratio breakout with momentum confirmation and the newly rising 50-day moving average (see chart for more details), we can now argue that growth companies should not be favored because so many of us have become comfortable with trading them in recent years, but because there is technical evidence to suggest that they should continue to outperform the benchmark S&P 500, at least for the near-term.
Now that we’ve identified this dual-factor leadership of both size (i.e., growth) and momentum (i.e., the new leadership trend signaled by the ratio breakout), as traders we can either look to establish long positions in IWM (the ETF) or in the constituents of the ETF.
This next table shows some of the top holdings of the IWF, as provided by ishares.com.
Figure 2
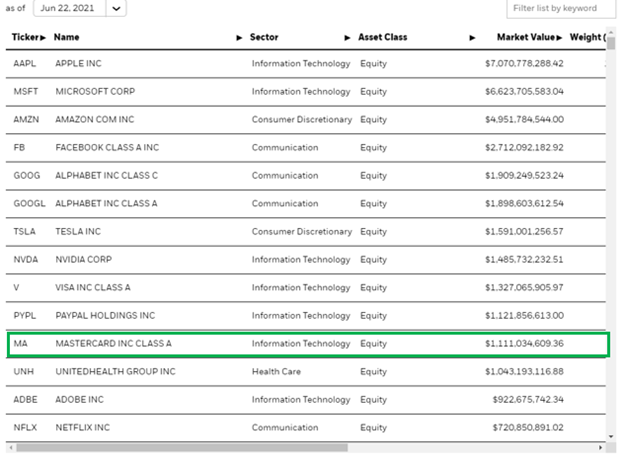
In the number 11 slot, you’ll find MA (Mastercard Inc Class A shares).
I’ve had this on my radar for a bit, and as the chart directly below reveals it is now using former resistance as support (see green rectangle on the chart directly below).
Figure 3
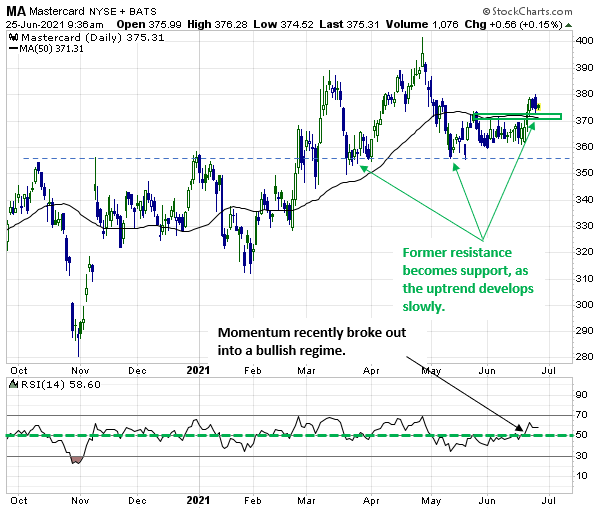
When a trader combines the upside price rotation shown directly above with the relative performance breakout discussed earlier, he or she is now using factor-based analysis to speculate that there is a relatively high probability that Mastercard (MA) can deliver alpha over the near-term.


5 Comments
Thanks Jeff
Beautifully laid out and explained.
Hello, I enjoy reading all of your article post.
I wanted to write a little comment to support you.
Interesting
Thank you very much Jeff