

Back on August 28th, I brought three Uranium stocks to your attention because of the “explosive” upside potential that existed at the time.
Just one day later, the explosion began.
Cameco (CCJ), Denison Mines (DNN), and Uranium Energy Corp.(UEC) are just three stocks within an industry that may be poised for a massive move over the months and, quite possibly, years ahead.
Recently, after a brief correction during the second half of September, the sector has seen another price surge, which, for traders like myself who don’t like to chase trades, makes it difficult to find the right spot to buy.
Look, the stock market has been crazy in recent years, with numerous stocks constructing lasting rallies that defy logic.
Therefore, we can’t ignore the possibility that this sector may have already left the station for good.
With this potential scenario on the table, today I am going to show you two ways to approach this sector.
One way will cater to patient traders like myself, while the other will cater to more aggressive momentum traders.
The long-term case for Uranium is strong
The recent global energy crisis has once again brought nuclear power as an efficient alternative to unreliable “green” energy to the attention of traders around the world.
After years of stagnant prices, a recent surge in the cost of nuclear fuel, uranium, has helped attract investors back to the sector, especially with France, Finland, and Japan recently hinting at making preparations to restart their nuclear power plants.
The jump in natural gas and coal prices to fresh highs this month has also worsened things in Europe and China.
Here’s how a momentum trader can approach this sector
When you’re fortunate enough to hitch on to a good momentum trade, that old adage, “the trend is your friend” becomes something to live by.
Momentum traders believe that these trends, whether up or down, will continue to head in the same direction because of the momentum that is already behind them.
When a momentum trade has truly gone “beast mode,” as my partner Jason Bond likes to say, there’s basically no stopping it, and any pullbacks that might happen as the trade is developing are often too small to notice.
Trust me when I tell you that in real time, when a winning momentum trade is producing exponential growth in your PnL, emotion can often get the best of you, leading you to trim too large a position too early.
By using the stock’s volatility to construct a trailing stop, however, you can ride this glorious “beast mode” phase for all it’s worth.
So how is this done?
The method I’d like to introduce you to today is something called an ATR-based volatility stop.
ATR-based trading plans are hugely popular.
As a trailing stop method during periods when a momentum trade has gone parabolic, it can be used to signal when a pullback has gone too far for the trader to feel comfortable that there is still enough panic buying interest to keep a parabolic rally going uninterrupted.
If you think about the math here, a 1x ATR price move is within the realm of normalcy for whatever lookback period you’ve put in your ATR settings.
How is the ATR stop calculated during a trend?
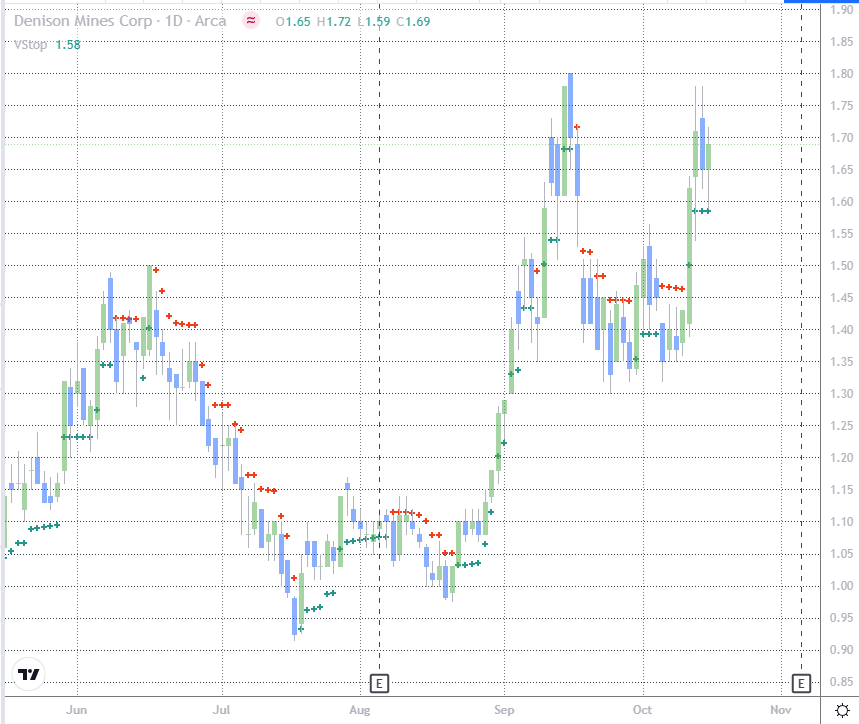
As Figures 1 – 3 below show, when a stock is trending higher, the indicator is simply calculated by subtracting the ATR from the most recent closing price.
If the price happens to close lower, but not low enough to trigger a reversal below the trailing stop, the indicator never falls, it simply remains at the highest level obtained during the active uptrend.
Only when the price falls far enough (a > 1 ATR decline) and closes below this stop will the indicator switch from bull trend mode to bear trend mode.
Putting the ATR into practice
Remember, during parabolic rallies, when panic buying is so great that traders are literally climbing over each other to buy shares, there’s often very little in the way of downside price action.
So, if you think about it, to see a stock fall more than 1 ATR during this phase means that the panic buying is starting to dry up.
While a short-term trend breakdown signal is only given when the stock closes below these stops, some traders do use intra-day violations of this stop as a signal to take small profits.
Figures 1-3 below show examples of this, where we see Moderna has been rising this stop higher in recent weeks.
Figure 1
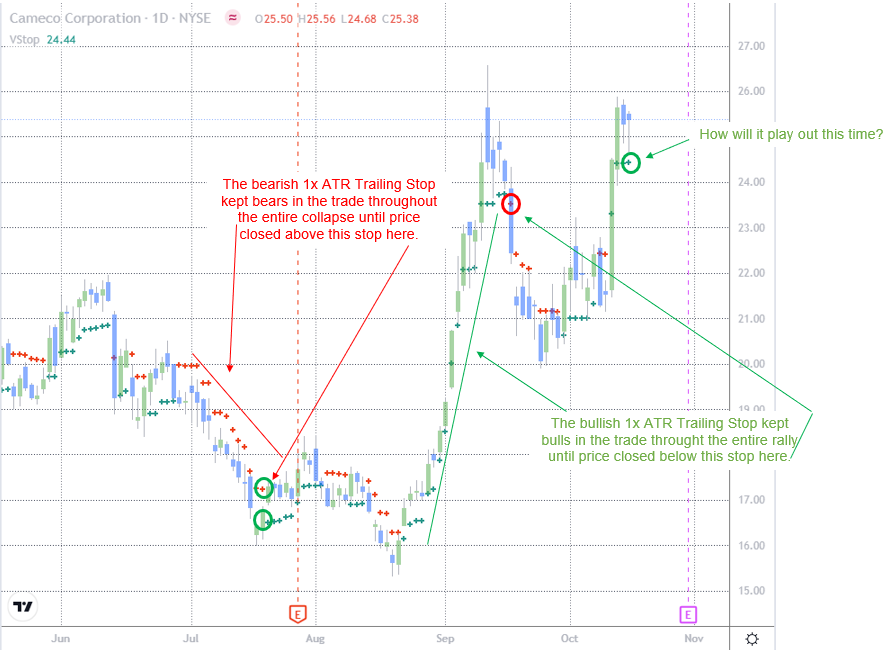
Figure 2
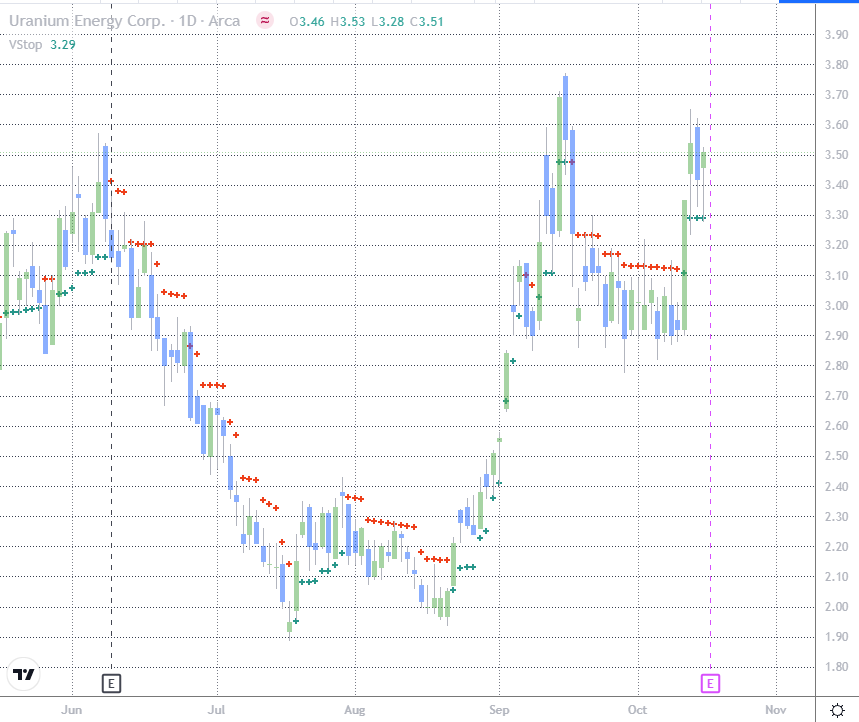
Figure 3
Volatility is an extremely versatile tool, and simple volatility tools like this one are at the core of many black box trading systems.
What I’ve shown you today is a method used to keep traders in what is now the most aggressive part of a momentum trend.
When this short-term trend following method signals that the parabolic short-term trend has broken down, it is not uncommon for price to take a breath before resuming its uptrend at a decelerated pace.
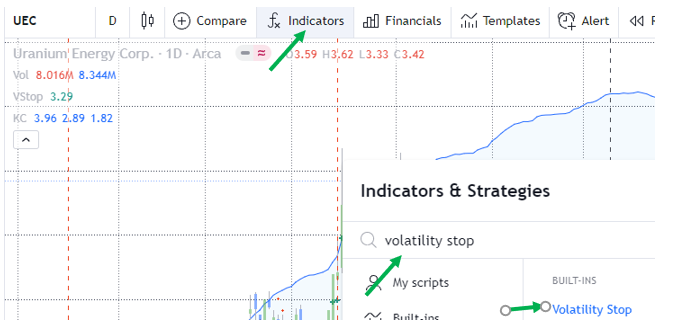
How can you add this tool to Tradingview and thinkorswim charts?
As Figure 4 shows, within Tradingview, select the Indicators tab at the top of the chart, then type in “volatility stop,” then select volatility stop from the dropdown menu.
Figure 4
As Figure 5 shows, within thinkorswim, select the Studies tab at the top of the chart, then All Studies, then A-C, then ATRTrailinStop.
Figure 5
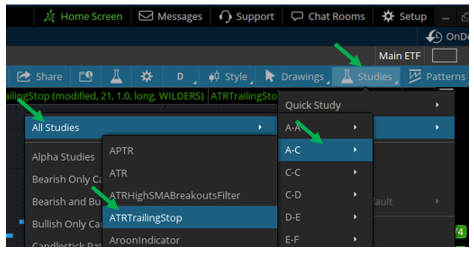
Like any trading tool, be sure to read the details regarding how your trading and charting platforms construct this indicator, since the default multiplier typically is NOT a 1x multiplier (it’s often a 2x multiplier) and will need to be changed to fit the method discussed here today.
How should more patient traders approach this sector?
For patient traders who prefer not to chase rallies, there is certainly no shortage of strategies that can be used to enter long positions during price pullbacks.
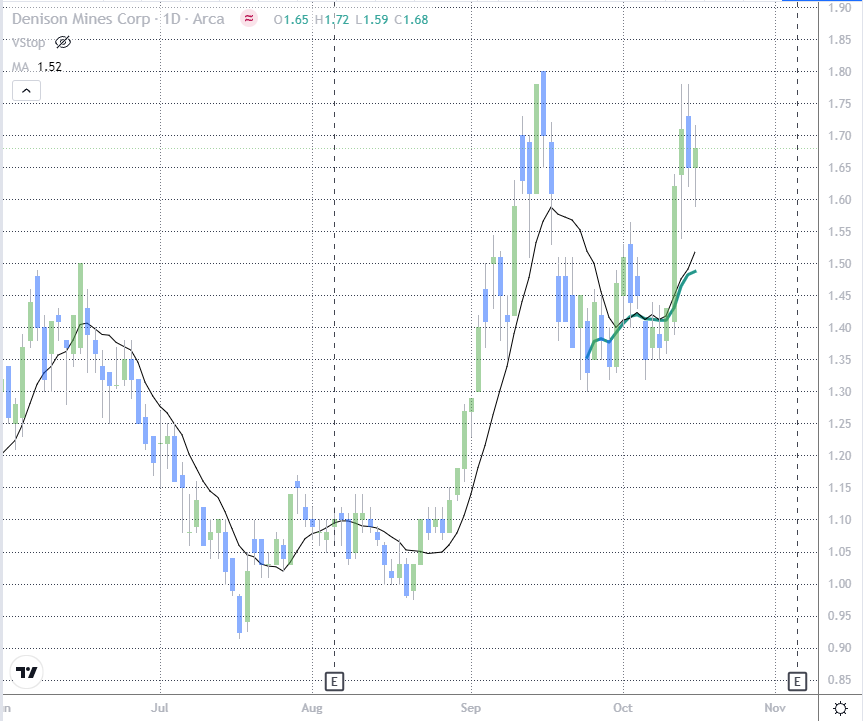
No matter which strategy you use, whether it be waiting for a retest of a recent breakout area or buying after a certain Fibonacci retracement has occurred, it’s often good practice to find an area on the chart that is made up of more than one support level.
An example of this is shown on Figures 6 – 8, where I would be interested in entering a longer-term buy and hold position if either of these stocks happened to pull back to support that is made up of the 30-day moving average and the Anchored VWAP originated at the most recent cycle lows.
Figure 6
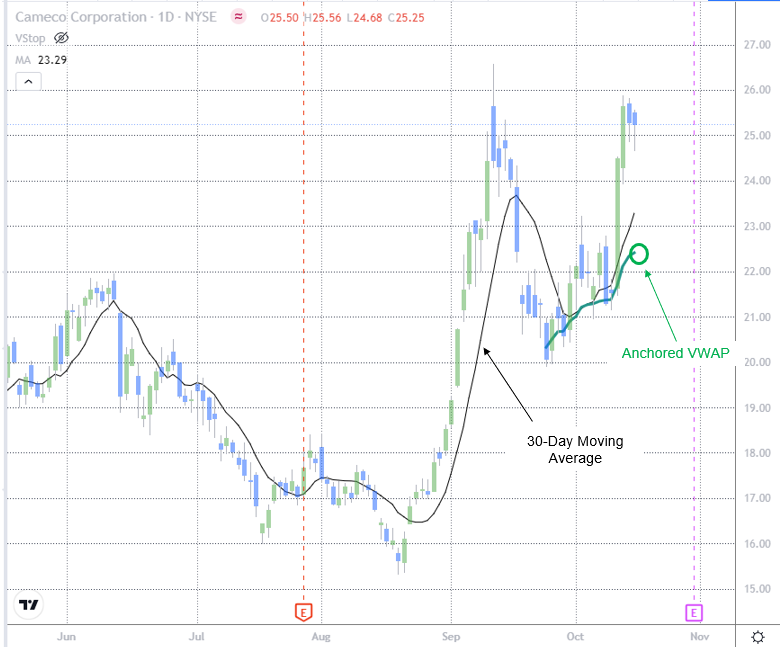
Figure 7
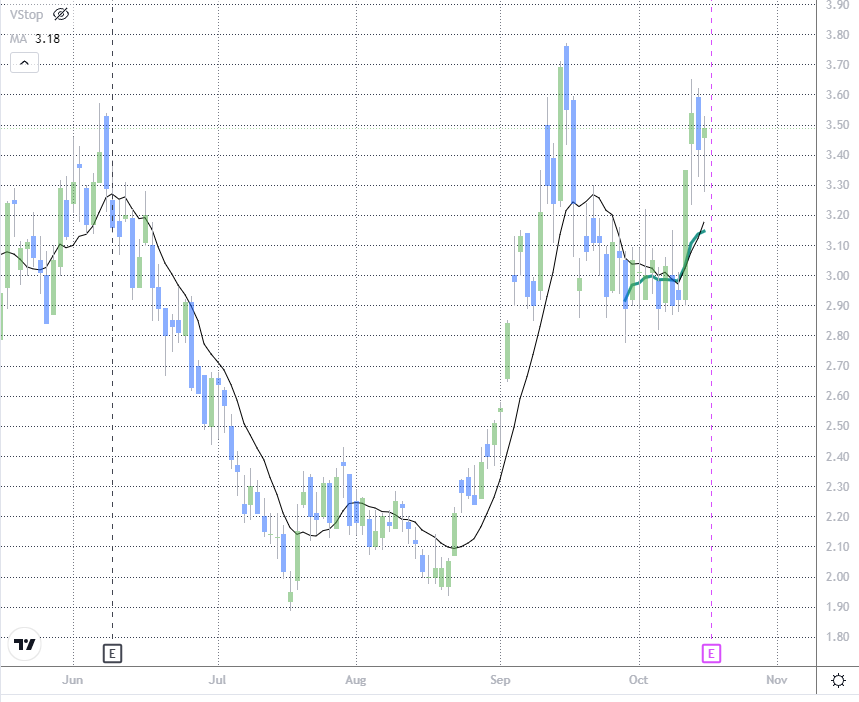
Figure 8


1 Comments
Great knowledgeearned