

It might seem obvious, but the stock market is a market of stocks, DUH! But when we constantly hear about stocks like AAPL and TSLA we might forget that there is an ocean of publicly traded companies, and some are good, some are bad, and some are outright frauds!
Elite traders are market professionals, and just like other professions, we must stay up to date with what is happening in our industry as a whole. Market Breadth is a way of analyzing the stock market’s health, just like a doctor might explore a heartbeat or pulse of a patient.

Today we will discuss this essential indicator, how traders use it, and how it can be used to improve trading skills.
Market Breadth
Market Breadth indicators analyze the number of stocks advancing relative to declining in a particular market index or exchange. It is critical for traders to analyze the strength of a specific market rally and provide clues about whether a move is sustainable or if a correction might be near.
The more stocks are advancing than declining— the more bullish the market sentiment and likely the market rally can be sustained. When the market is really strong, the rally is broad across sectors.
Advance-Decline Indicator
One way to analyze market breadth is to look at the number of Advance-Decline Issues ($NYAD in StockCharts). It simply shows how many stocks are advancing versus declining in any given period on the New York Stock Exchange (NYSE).
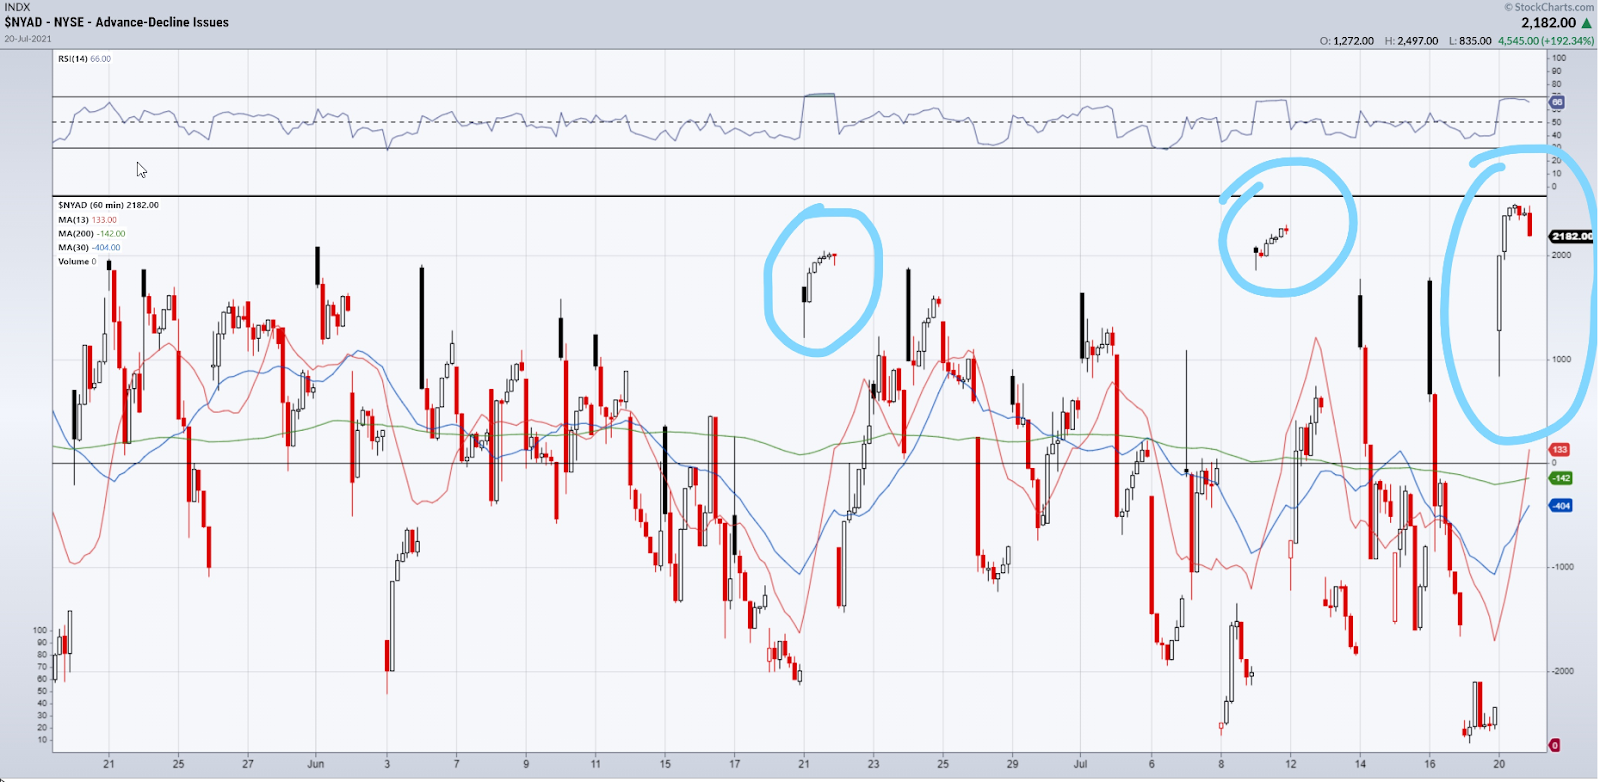
Here is an example of the $NYAD. What we’ll find is in the days where more stocks are participating in the rally than usual, i.e. a reading holding at around 2000 and above, those are the days that the SPY will more likely have a larger move than usual. This is when the SPY expands its range and trends all day, i.e. known as a trend day.
The 3 largest trend days in the SPY are highlighted above in the $NYAD and below on a chart of the SPY.
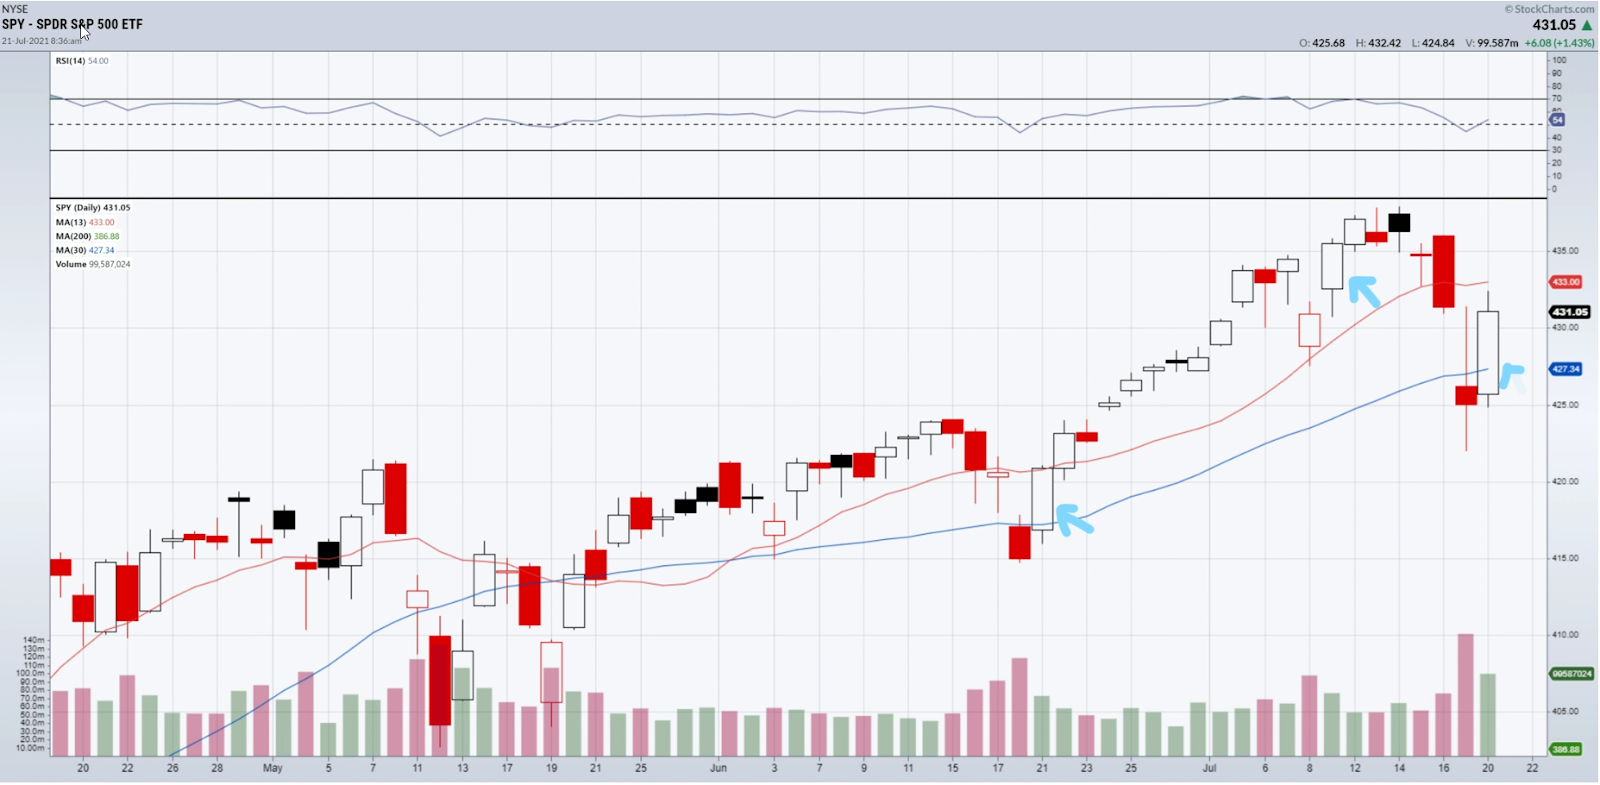
They were the 21st of June, 9th of July, and 20th of July. One simple way to use this indicator is to simply avoid shorting market stocks or the SPY on days where $NYAD is holding at or around 2000 as those are days that the SPY may be more likely to close on its high.
We could also be more on alert to buy pullbacks or have greater conviction in joining trends in our favorite strong market stocks on such days.
Nasdaq Percent of Stocks Above 200 Day Moving Average (EOD) Indicator
Another Indicator we can use to analyze market internals is the Nasdaq Percent of Stocks Above 200 Day Moving Average ($NAA200R in StockCharts).
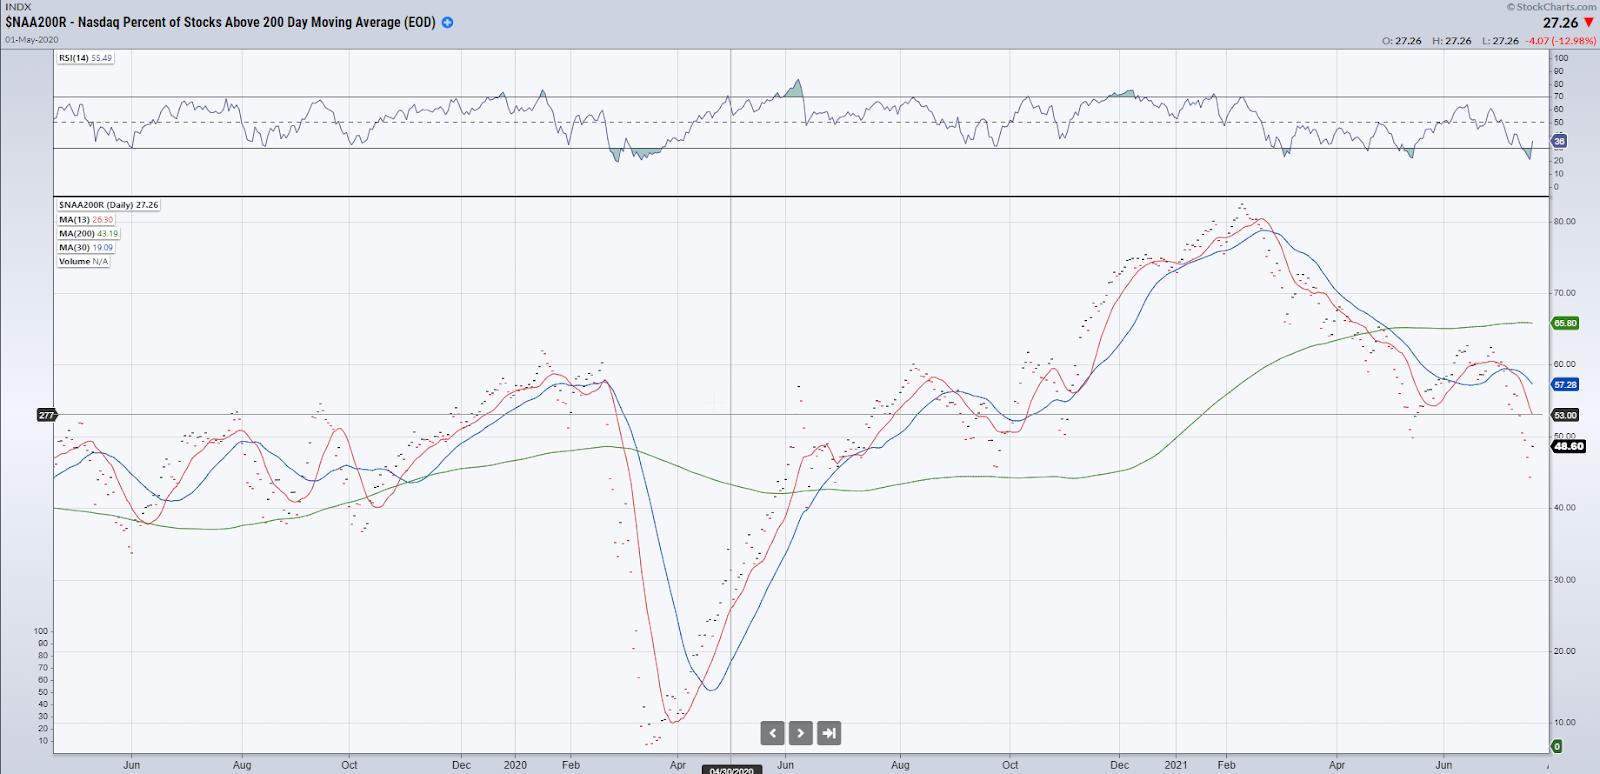
In order for a market rally to be sustained, market breadth should continue to be positive with the Indexes. This is exactly what we saw in the QQQ’s and the $NAA200R from the April 2020 Covid lows to the highs in February 2021. However, since then we have seen a divergence.
What has taken place is a rotation out of smaller cap tech stocks and into the larger FAANG names, i.e. Facebook, Apple, Amazon, Netflix, Google. Thus, the larger market cap stocks have gone to new highs whilst money has rotated out of smaller tech companies. The $NAA200R gives a good representation of the market internals of NASDAQ tech names.
Now one of two things is likely to happen next. Either investors will find smaller tech companies attractive at these prices and the $NAA200R will help the QQQ’s continue to march higher. This is the more probable outcome in a normally cyclical bull market. Or alternatively, this is an early sign of weakness in the tech sector as a whole and will lead to a correction in larger cap tech stocks and the QQQ’s.
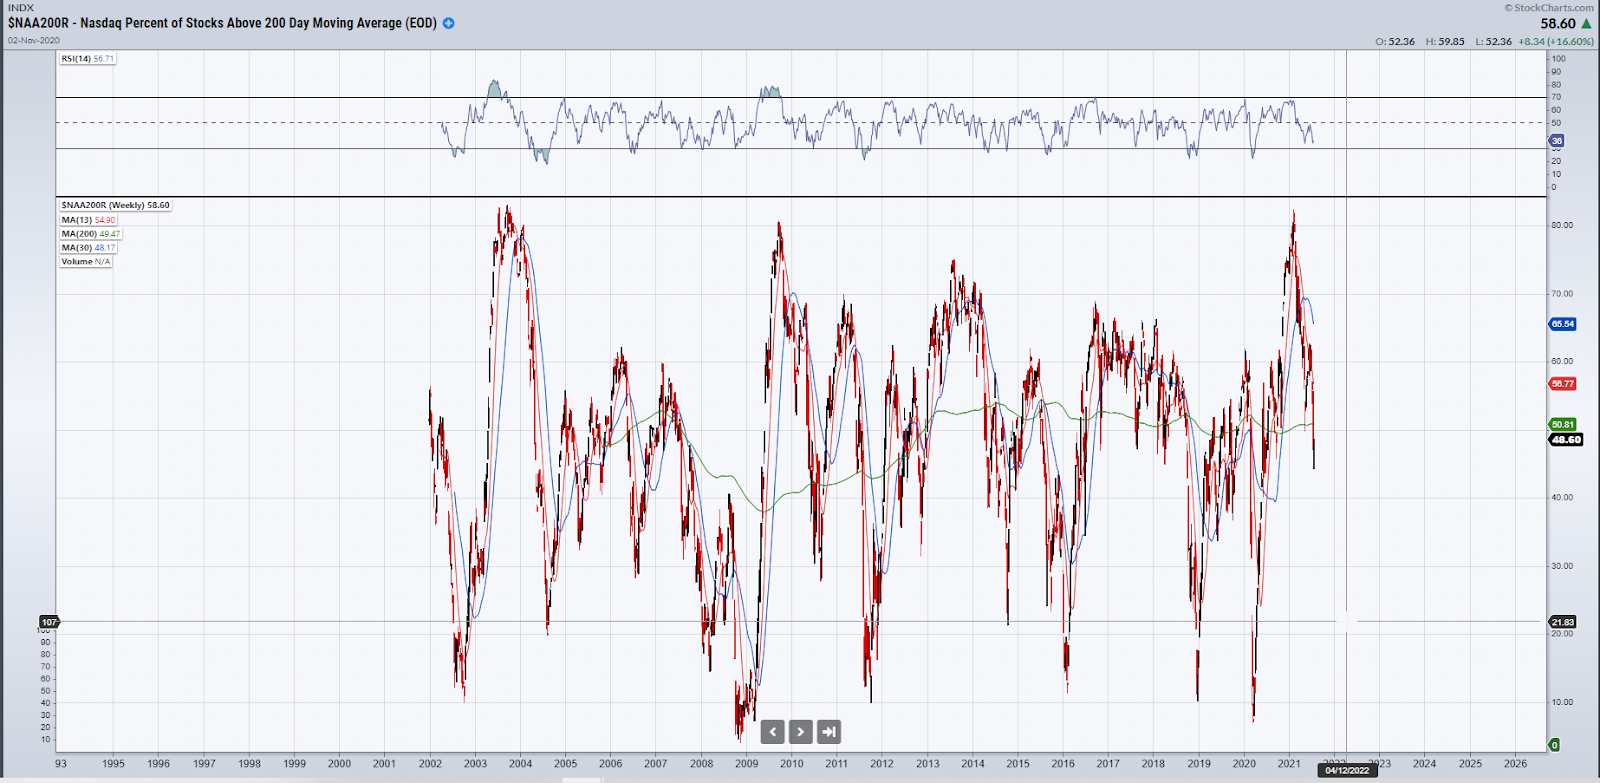
If we take a look at the weekly $NAA200R chart over the last 20 years we can also see that when we see 80% of stocks in the Nasdaq above the 200-day, that tends to be a sign of euphoria and signals a short term top in these names may be near.
In contrast, when only 10% of stocks are above the 200-day moving average, this extremely low percentage is a sign of max fear and that a short-term bottom in most tech names may be at hand.
Bottom Line
Market Breadth gives us a snapshot of what is happening within the stock market as a whole. Like a doctor using a surgical microscope, Market Breadth allows us to see inside the internals of the stock market, including how many stocks are making new highs, which is very important in identifying the state of the health of a market. Indicators such as Advance-Decline and What percentage of stocks are above the 200-Day moving average give us a deeper understanding of how the market is acting and give us better context when looking for trading opportunities.


