

Previously we explained VWAP, an indicator I have recently added to my trading arsenal. We explained how institutions use VWAP to fill orders and how we can use it to identify the trend and thus avoid fighting a trend.
Today we will discuss how we can use VWAP to:
Identify where market participants can be positioned and use it to make more informed trading decisions.
Let’s use MARIN SOFTWARE (MRIN) as an example of how to use intraday VWAP to identify how market participants can position themselves.
A Great example of Trapped short sellers in MRIN, using VWAP as confirmation.
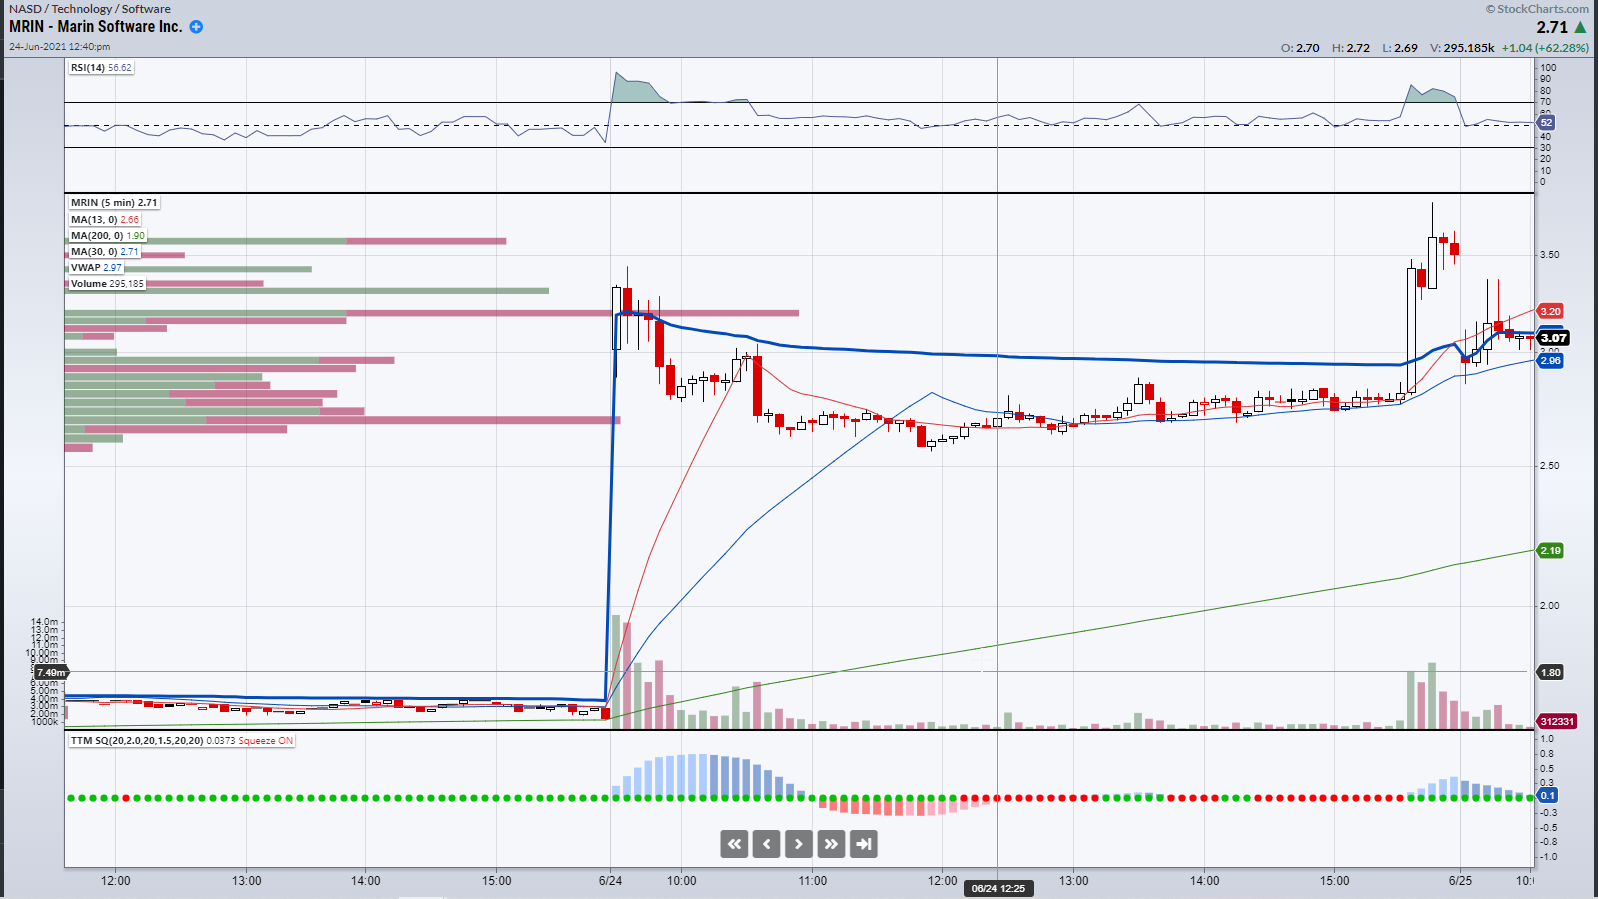
MRIN gapped up from a price of $1.71 to open the day at $3.01 up on the news. After hitting a high of $3.44c on the open MRIN broke down below intraday VWAP (thick blue line) and found a seller right there around $3.00 on a retest in the morning. It then held at around $2.75c for most of the afternoon.
Now let’s think about using VWAP to determine where participants position and how they might react. So we failed at VWAP in the morning and have held below for most of the day at $2.75. VWAP is the Volume weighted average price for the day, and coming into the close, it was around $2.90.
Any short-sellers who have been shorting for a gap fill back to $1.71 are wrong above this price. We can see there is a buyer in the stock at $2.75 that will not let the price go down.
A move above VWAP would mean the short seller’s thesis is officially wrong. If they were right, VWAP would act as resistance as it had in the morning.
Many day traders need to cover before the end of the day, which provides added fuel to the move. Timing is also essential, and we broke above VWAP at 3.30 pm very late in the day, which provides us with even more edge.
Bulls will also want to inflict as much pain as possible on stubborn shorts. All of this leads to an explosive move as VWAP is reclaimed.
Shorts are wrong, and we break above $2.90 to $3.80, a 30% move in a matter of minutes stopping shorts above VWAP and above the high of day at $3.50.
We saw an identical pattern occur in MRIN the following day.
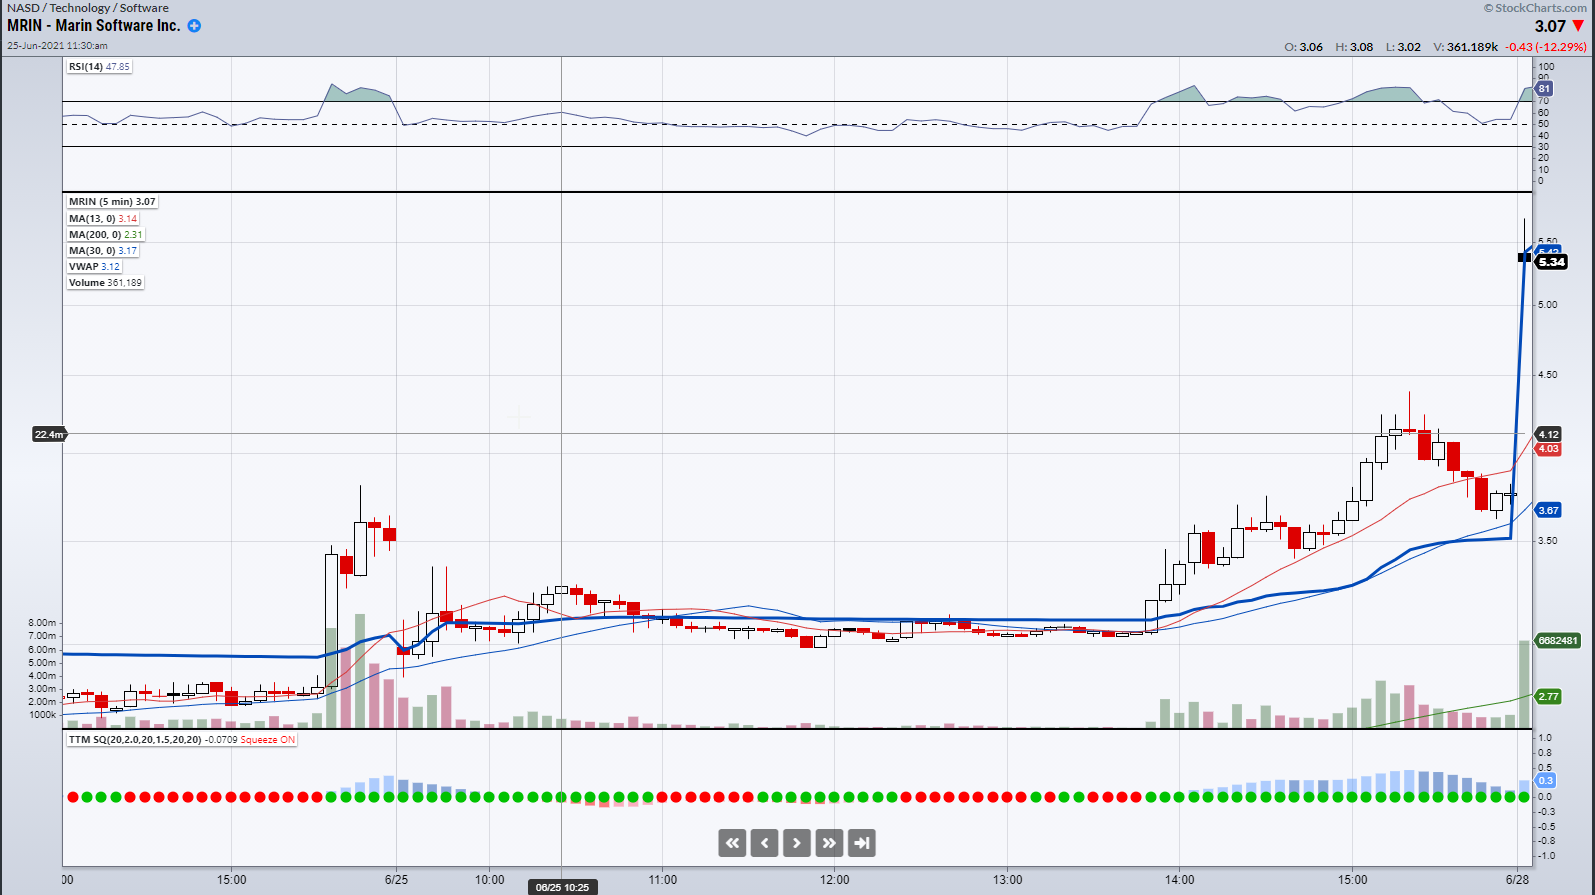
Once again, shorts were trapped below VWAP at around $3-$3.10. Once VWAP was reclaimed there was an explosive move in the afternoon, taking short sellers to the woodshed from $3 to $4.40 on volume and we held above the previous highs of the day.
We call this trade the VWAP reclaim trade. While we have used VWAP here on a short-term time frame to explain how participants can be positioned and trapped, the same principles apply on a longer multi-day time frame.
Lets take a look at AMAZON.COM (AMZN) over a multi-day timeframe:
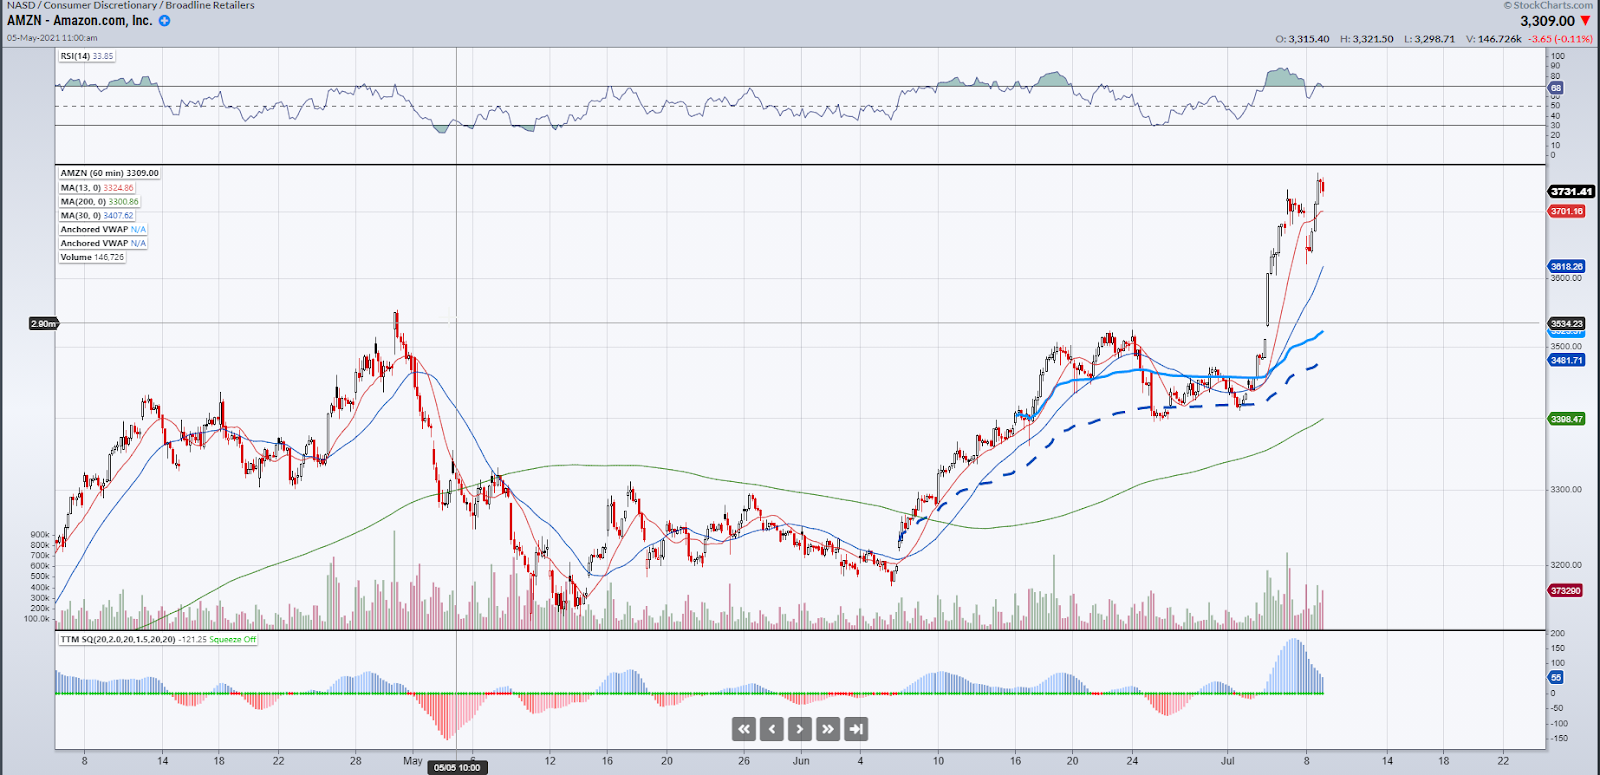
Above I have included 2 anchored VWAP lines. One is from the breakaway gap on June 8 (the dashed blue line). The other is from the Fed meeting on Jun 16, 2021. Lets analyze the positioning of market participants just as we had on a short term timeframe above.
As we can see, a trend has formed from June 8 with buyers in control. The VWAP from this date (dashed blue line) is our trend line and we can see that buyers stepped in right at VWAP, a potential area of support to create a higher low before breaking to the upside.
Buyers held the average volume weighted price from this date and pushed the stock even higher.
Now let’s analyze VWAP from Jun 16, 2021an important date from a market context as this was the date of the FED meeting. Initially, it acted as support on June 21, before consolidating below and acting as resistance on June 30th.
However, as with MRIN short sellers were not able to take the stock lower and as we consolidated below this VWAP short sellers became trapped.
Once VWAP was reclaimed, these market participants were proven wrong, leading to an explosive move higher to new all-time highs. Now I happened to be on the wrong side of this trade, enjoying my 4th July festivities a little early, missing this opportunity to exit my short and reverse my position but the power of VWAP as an indicator is there for all to see.
Bottom Line
We can use VWAP to determine where market participants position. This allows us to potentially identify where certain players are wrong and possibly trapped i.e. the pain point where they may be forced to exit. Understanding this information provides us with momentum trading and swing trading opportunities.


3 Comments
Thanks Jeff! How do you plot the dashed blue line VWAP from another later future date? Brilliant stuff.
Great Techniques and clear explanation. Many thanks Jeff
Thanks, Jeff! This is really helpful! I’m one of your Premier Members (Platinum – whatever), I’m so excited about it!! I think you and Jason are amazing! Thank you for all of your insights. KD