
US equity indices witnessed a sharp uptick in volatility late this past week.
As traders, it can sometimes be difficult to judge whether this is just the start of garden variety correction of say -5% to -10%, or the beginning of a much more prolonged bear market decline that approaches -20%.
When it comes to trying to answer this question, trust me when I tell you that the answer does not automatically lie in commonly used indicators like RSI and Bollinger Bands.
Instead, the answer often comes from a market where enormous amounts of institutional money is positioned using carefully crafted risk-management strategies.
I’m about to show you how to keep track of this market by using free government data sources and a very basic trend following strategy.
The Corporate Bond Market Often Holds the Key to Understanding the Stock Market’s Corrective Risk
When it comes to market indicators, perhaps none is more respected than the corporate bond market.
Now, I know what you might be thinking…a discussion about the corporate bond market is likely to be incredibly complex and boring.
While there is certainly the potential for this to be the case, I assure you that I’ll craft this discussion in a way that is both interesting and easy to understand, because I firmly believe that having a basic understanding of how to read this key market’s signals can make you a better trader.
Teachable Moment:
When we measure the difference between two financial instruments, it is called the “spread.”
When it comes to ranking a company’s credit worthiness, most companies receive ratings according to their financial strengths, prospects, and operating history.
Companies that have manageable levels of debt, good earnings potential, and good debt-paying records will have good credit ratings.
Investment grade refers to the quality of a company’s credit. To be classified as investment grade, the company must be rated at ‘BBB’ or higher by one of the major credit rating agencies.
Companies rated below ‘BBB’ are considered non-investment grade.
If the company or bond is rated ‘BB’ or lower it is known as junk grade, in which case the probability that the company will repay its issued debt is deemed to be speculative.
The “Canary in the Coal Mine”
While no one has a crystal ball, measuring the demand for risk in the corporate debt market has proven to be a reliable method for seeing the future a bit more clearly.
For today’s discussion, we’ll be measuring the difference in yield between bonds that are rated below investment grade (i.e., BB or lower) and ultra-safe US Treasuries.
The chart directly below shows the ICE BofA US High Yield Index Option-Adjusted Spread.
Figure 1
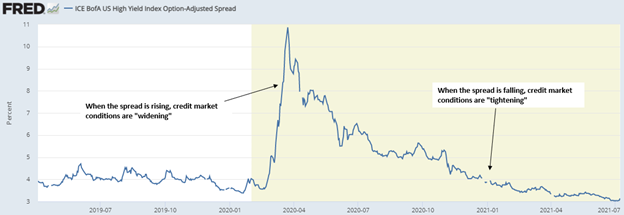
The screenshot you see above is from the St. Louis Fed’s free online research portal known as “FRED.”
This is an amazing resource for all sorts of economic and market indicators that I strongly advise you test drive at some point in the future.
You’ll notice at the extreme right-hand side of the chart that the spread has been sitting at multi-year lows in recent days.
When corporate spreads are falling toward low levels, conditions in the credit market are considered to be “tightening.”
Conversely, when corporate spreads are rising toward high levels, conditions in the credit market are considered to be “widening.”
What does the current “tightening” trend imply for the US stock market?
Well, tight credit conditions have historically been a good sign for equities.
Essentially, “widening” spreads have generally been associated with slower growth, while “tightening” spreads similar to what we’ve been seeing recently tend to coincide with faster growth.
As a trader, it is a good idea to always have an eye on credit spreads for any signs that conditions may be starting to widen against a rising stock market.
Again, this gets back to the fact that speculation in the corporate bond market is typically made by large players making relatively risk averse decisions.
Because of the enormous research resources these organizations have at their disposal, they are often able to sniff-out any economic or geopolitical risks to the equity market long before the general public.
Therefore, any leading indication of growing concern by these players generally shows up in the form of widening corporate credit spreads.
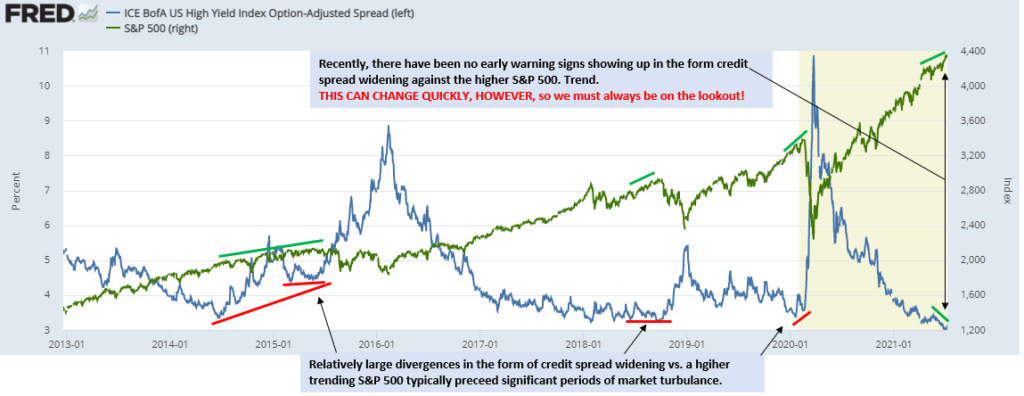
Historically, major market downturns of 20% or greater, or even periods of significantly increased volatility such as the 2015 window highlighted on the chart below, have been preceded by rather significant periods of credit spread widening against a rising stock market.
I’ve highlighted such instances on Figure 2 below.
Figure 2
How Would a Trader Use This Information Under Current Market Conditions?
Look, there’s no denying that the stock market has rallied relatively unchecked in 2021.
To be more specific, a study done by Guggenheim Funds found that, since 1945, declines of 5 percent or greater occur about 1.5 times per year. Market declines of 10 percent or greater occur roughly 0.5 times per year. Lastly, market declines of 20 percent or greater (bear markets), occur on average about every seven years.
So far in 2021, the S&P 500’s largest drawdown has only been -4.2%, from close to close, which is how corrections are officially measured (i.e., they are not measured from intra-day highs to intra-day lows).
So how should the lack of major concern from the credit market be interpreted at this point in time?
Quite simply, a trader should take the lofty market conditions that currently exist as an indication that being too leveraged to the long side is not advisable, as a healthy correction of the -5% to -10% variety would be a welcome development (based on historical tendencies) that can occur at any time.


10 Comments
Thanks for the info!
Good stuff!
Went through a little crisis, 5G first came etc.
Lost
Thanks again for the educational info that Jeff presents to the customers
Jeff, you’re a great teacher, but I don’t get it. I don’t get why the correlation and those credit spreads are a big deal. Thanks. KD
Vey useful information and education,many thanks.
I keep getting these doomsday stock market predicters delivering their junk mail. I think I should get some bear trades going.
Excellent approach to understanding the market
Thank you very much
Great article
thank you