

Major stock indices took a turn for the worse this Wednesday and continued to struggle with reclaiming the upside into Friday’s close.
Hit particularly hard was QQQ, which is an ETF that contains many of the large cap growth tech stocks that have become so popular amongst traders in recent years.
But this weakness did not just come out of thin air.

In fact, there is a long-standing intermarket (cross asset) relationship that caused this underperformance, and you, as traders, must understand how this relationship works so that you can learn to monitor it going forward.
Big tech companies struggle when interest rates rise. Why is that?
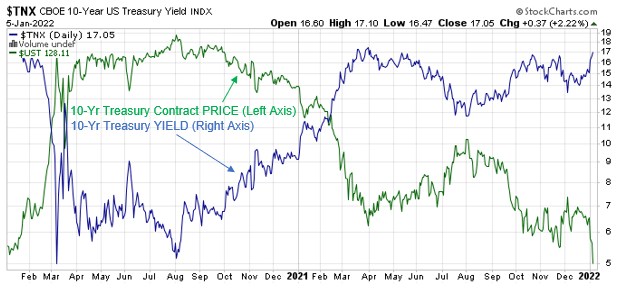
From a market perspective, when the price of US Treasury contracts like the widely discussed 10-Yr Treasury contract rises, the yield on that contract falls.
Conversely, when the yield on that contract rises, as it has been in recent days, the price of that contract (the asset that bond investors actually purchase) falls.
This is shown in Figure 1 below, which is a weekly chart of the 10-Year Treasury yield vs. the 10-Year Treasury contract price.
Figure 1
Interest rates are starting to rise again
The recent rise is due largely to a combination of inflationary pressures in the market and the Federal Reserve’s recent decision to start tapering its bond purchase program, which had been put in place to help keep the yields on these Treasury contracts low to help promote borrowing during the post-COVID-19 economic weakness.
While inflationary market rotation is good for some sectors like financials, it is not friendly to the large tech and growth companies that so many of us have loved to trade in recent years.
Why is this the case?
Because the large growth stocks like those that influence the movement of NASDAQ -100 ETF (QQQ) are valued based on future discounted cash flows.
Therefore, the higher rates go, the lower the present value of that future stream of earnings.
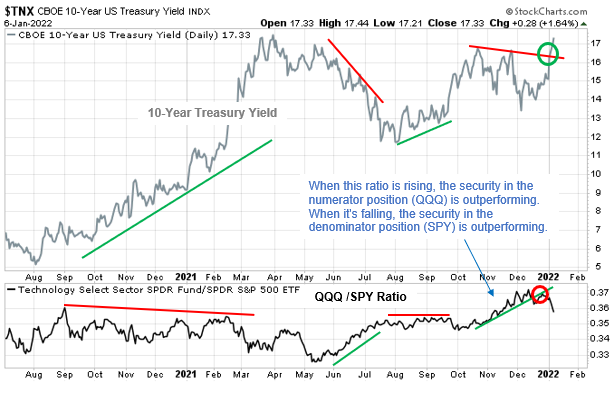
As Figure 2 reveals, large fluctuations in interest rates have been the key driver behind periods of leadership and underperformance by tech stocks.
Figure 2
There are other sectors that have been affected by these gyrations; however, these are the two sectors that we’ll be focusing on today.
How can traders monitor this rotation?
To monitor these developments on your own, it is always good practice to chart the relative strength ratio between a tech-heavy index like QQQ or XLK (S&P 500 Technology sector) vs. the benchmark S&P 500.
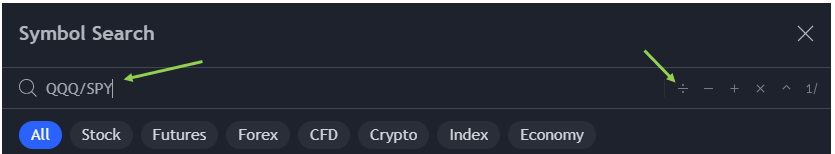
To do this in Tradingview, enter the first ticker (in this case QQQ) then select the division sign (see Figure 3 below), then enter the ticker for the benchmark (in this case SPY for the S&P 500).
Figure 3
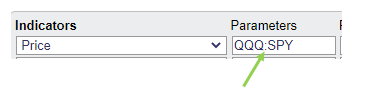
To do this in Stockcharts.com, enter the first ticker (in this case QQQ) then type a colon (see Figure 4 below), then enter the ticker for the benchmark (in this case SPY for the S&P 500).
Figure 4
Here’s how I’m trying to take advantage of the recent increase in volatility
Asana Inc. (ASAN) options have been trading rich of late as the implied volatility is high near 85%.
This can be seen in Figure 5 below.
Figure 5
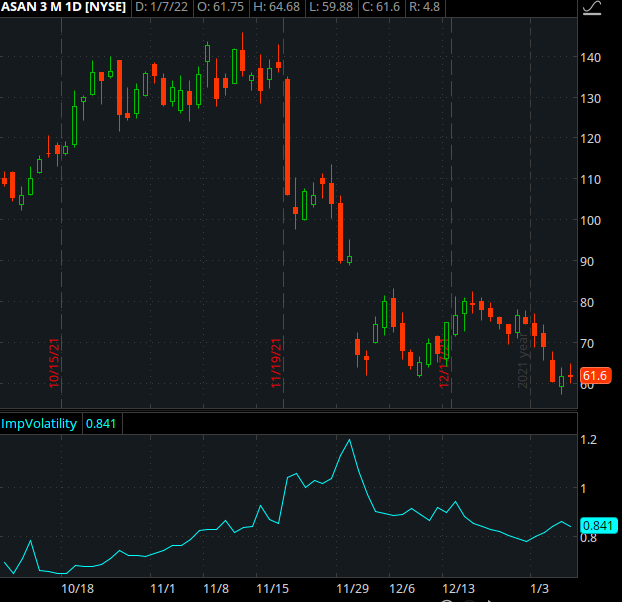
When this occurs, this lends to selling premium strategies really starting to shine.
That means as the stock approaches what I think will be support, I want to get long the stock by selling a bull put spread, also known as a credit put spread.
My Trade Setup is as follows:
Sell the 18 Feb 22 50 put
Buy the 18 Feb 22 45 put
When would a trader use a bull put spread?
This trade is best utilized when a trader has a neutral to bullish opinion of a stock or ETF.
Since the trader is a net seller and collecting a premium, the trade benefits from both time decay and rising stock prices.
The trade is also statistically proven to provide better odds of success than many other trading strategies.
What are the basic mechanics of a bull put spread?
A bull put spread is the easiest multi-leg options strategy to learn because it consists of one long put with a lower strike price and one short put with a higher strike price, both of which have the same expiration date.
Since the trader is selling the put with the higher premium, a bull put spread is established for a net credit (or net amount received).
The trade profits when the value of the spread declines over time.
What’s the maximum profit potential?
The maximum a trader can make on this trade is limited to the net premium received (minus commissions).
The maximum profit is realized if the stock price is at or above the strike price of the short put (higher strike) at expiration and both puts expire worthless.
What’s the maximum loss potential?
To find the maximum that can be lost on the trade, find the difference between the strike prices minus the net credit received (plus commissions).
The maximum loss risk is realized if the stock price is at or below the strike price of the long put at expiration.
What’s the breakeven point of the trade?
To find the breakeven point, take the strike price of the short put (higher strike) and subtract the net premium (credit) received.


1 Comments
Jeff, I believe you went from buying ASAN calls off the apparent bottom, a trade that blew up, to a bull put spread on the same ticker. If this thing continues to fall you will lose on this trade too. As a user of Asana software myself, they have plenty of competition in that space. And, if interest rates rise further, which they will likely do, the present value of their cash flows will decline like the other tech stocks as you’ve mentioned. Where is your edge?