

For anyone looking to learn about what can make a good swing trade idea, 8Ball has identified one of the original meme stocks with a setup that checks all the boxes.
He likes the setup so much that he decided to make this stock this past week’s “Pick of the Week.”
I’m about to teach you how simple it is to incorporate key fundamental inputs into your screening process.
In addition, I’m going to show you how to use technicals to determine when a stock’s price is ready to move in the direction of its fundamental valuation.
The fundamental setup
When we think about some of the “OG” meme stocks, Nokia Corp. (NOK) was among the first to earn this classification.
From a fundamental perspective, 8Ball’s bullish thesis is pinned to NOK’s excess Free Cash Flow.
Teachable Moment:
Free cash flow is the surplus cash remaining after a firm has run its basic operations, paid dividends, and spent the cash required to keep up with the competition and to continue growing.
Free cash flow is important because it represents surplus cash that a firm could use to raise dividends, buyback shares, or expand into new business areas.
Quite simply, these are the nuggets that investors look to for signs that a company is increasing shareholder value.
While it is always better for companies to have high levels of free cash flow, it is also possible for a company to have negative free cash flow.
This is usually the case when a company is “burning” too much money.
Companies stuck in this category either must cut expenses or dividends, or they will have to raise cash by selling more shares (which is dilutive) or by borrowing, all of which decrease shareholder value.
A common way to measure a stock’s free cash flow is to calculate something called the free cash flow yield. I’ll walk you through the process of how to screen for this in just a moment.
For example, a company would have a free cash flow yield of 10% if the stock is priced at $200 per share and is generating $20 per share of free cash flow over the past 12 months.
Recent analyst upgrades favor higher prices
On 07/05 NOK was upgraded at BNP Paribas, with a price target of $7.70.
Barron’s also joined the mix recently, stating that there is an inflection in demand for this technology.
How technicals may reveal when it’s time to trade the fundamentals
From pattern breakouts to momentum signals, there are numerous ways technical tools may help traders decide when it’s time to speculate on a relatively large price move.
8Ball’s view coming into this week was that NOK’s setup resembled a “Bullish Swing” pattern.
Let’s break down the reasons why.
As the chart directly below shows, NOK began the week trading above its gap level created between 06/24 and 06/25.
This big-volume gap was formed when Goldman Sachs upgraded the stock to $6.50 (from $4.90), and it developed just days after the stock forged the low-end of a rising channel originating at the 03/15 high and 04/23 low.
Lastly, as recently as this past Thursday, the MACD Histogram witnessed its first positive reading since June 10th.
Figure 1
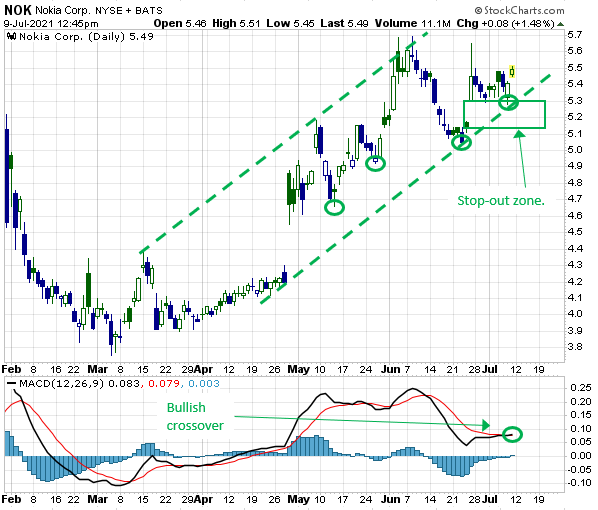
With the MACD indicator signaling a turn back in favor of bullish momentum, a swing trader could then begin to speculate that the stock will soon begin to move up to the high-end of the rising price channel discussed above (currently $6.16).
As always, such a setup is desirable not just because of the timing signal provided by the MACD indicator and the potential target produced by the rising channel, but because of the well-defined stop-out zone created by the combination of the 06/24 to 06/25 gap, rising-channel support, and the 06/23 pivot low (all in the area of $5.15 to $5.30).
Remember, well-trained traders should always enter a trade with a plan.
If you were to enter this particular swing trade, your thesis would be grounded in your belief that the series of higher swing lows (see green circles) of the past several months was about to continue.
Therefore, any downside violation of the $5.15 to $5.30 stop-out zone would signal that your thesis is wrong and it’s time to take a small loss and move on.
How can traders use Finviz as a tool?
Anyone with an internet connection can screen for stocks with high levels of free cash flow, for free.
One way is to use the free version of Finviz.
Below, I’ve provided a screenshot of the simple steps one needs to take in order to find this input.
Figure 2
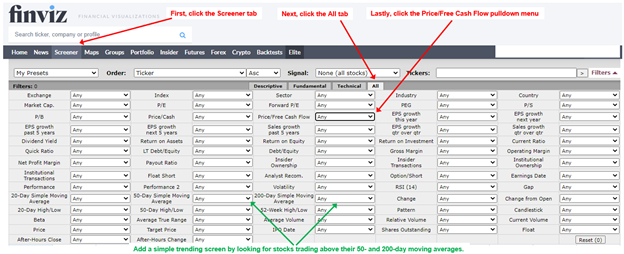
From there, all you need to do to create a powerful screen that also incorporates a strong technical component is screen for higher trending stocks.
To do this, look for stocks that are trading above their simple 50- and 200-day moving averages.


3 Comments
Very helpful for us novice traders, thank you
Thank You Jeff
I appreciate this valuable information
Welcome back
Thanks, Jeff! Always love to know what else we can do with Finviz! KD