

When it comes to trading indicators, I like to keep my charts pretty clean with the bare essentials for my trading. I use the 13, 30, and 200 simple moving averages and a 14 period RSI based on a 1hour timeframe chart to help me identify the trend.
This year, I added another quiver to my arsenal, that being Volume Weighted Average Price (VWAP). Thanks to my friend Kenny Glick for putting me on to this. VWAP is such a great tool that for some traders I know, it is the only indicator they use!
Today I’m going to share with you the details of how I’m implementing it and how it can be used to make more informed trading decisions.
VWAP gives the average price traded throughout the day or over multiple days based on both price AND Volume. It has advantages over classic moving averages, which incorporate only price in their calculation.
Institutions and VWAP
Institutions are measured against VWAP as to how well they have performed in selling or buying stock for a client. For example, consider a large institutional customer who has instructed his institutional broker to sell a large amount of TESLA (TSLA) on a particular day.
What does the broker do? The order is so big that they will not sell it in one go usually unless they do a block order in a dark pool with another institution which we will discuss another time.
They will fill the order in smaller lots throughout the day so as to have as little impact on the current market price of the security as possible and get the best possible prices for their clients.
You could imagine what would happen if the broker-sold all the stock at once with a market order. The price would go down very quickly, giving the client a terrible price, and once that supply is gone, the stock would probably get bought back to where it came from. This would be a poor outcome for the selling client.
Furthermore, most institutions have algorithms programmed to execute large client orders based on the VWAP.
Here is VWAP in Action:
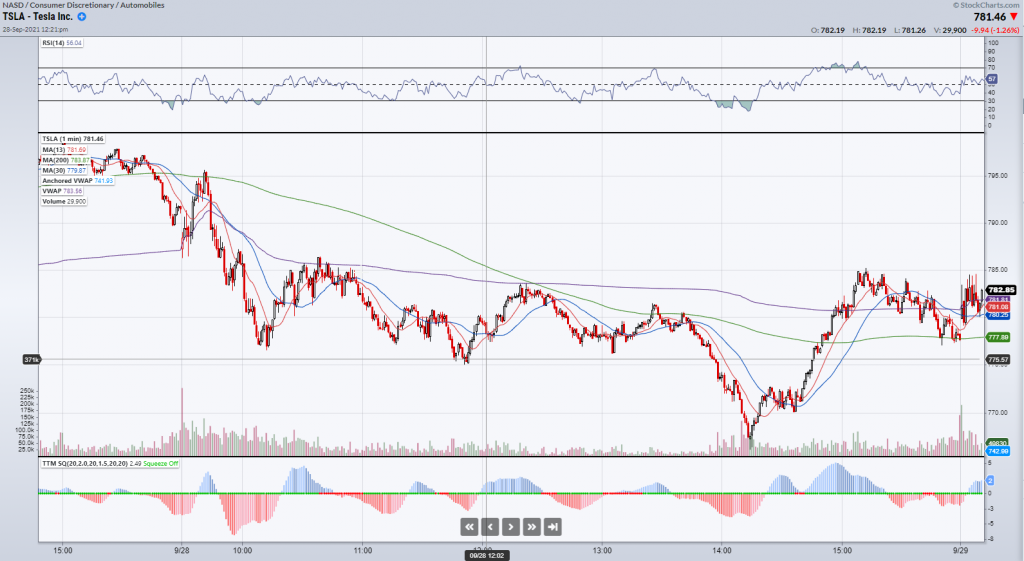
1 Minute Chart of TSLA with Intraday VWAP
The purple line above is the intraday VWAP for TSLA from yesterday. You can see that TSLA finished the day at 777.56 while VWAP was at 780.6. A client that is selling stock on this day would be much happier to have their order’s filled as close to VWAP as possible rather than significantly below, as was the case at various points throughout the day.
Using VWAP to Make Trading Decisions
So how can VWAP help us to make trading decisions? VWAP can help us do a number of things
- Identify Trend
- Identify Where market participants (buyers and sellers) may be positioned
- Identify areas of Potential Resistance and Support
Identifying The Trend
Looking at the chart of TSLA we can see that it opened strongly with buying on the open. It failed to hold its gains and sold off quickly after that spike below VWAP and made new lows for the day. This is not how a strong stock usually behaves.
Clearly, the trend of VWAP for most of the day was down, just by looking at the direction of the line representing VWAP.
I use this indicator to avoid being on the wrong side of a trend. For example, if VWAP is sloping downwards, I may not want to get long stocks against the trend while this is the case, or perhaps at the very least, I will avoid buying stocks into VWAP where there may be large institutional orders waiting to be filled.
Identify areas of Potential Resistance and Support
Furthermore, surely it was no coincidence that resistance for the stock was right at VWAP (perhaps some large Institutional sell orders being filled as we had discussed?) TSLA pulled back towards VWAP on 3 occasions throughout the course of the day, where it found sellers for a short trade setup. This is how VWAP can be used as potential support or resistance, especially in a trending stock!
Identify Where market participants (buyers and sellers) may be positioned
VWAP can also be used to identify where market participants may be positioned and figure where they may be trapped. I’ll discuss this in more detail in a follow-up article on anchored multi-day VWAP.
Bottom Line
VWAP is an indicator that I have recently added to my trading arsenal. Institutions use it to judge how effectively client orders are filled. Algorithms are used by institutions programmed around VWAP to fill client orders and funds to take advantage of price action around VWAP. It is also a valuable, useful indicator to make trading decisions, as VWAP can be used as an area of potential support or resistance.


2 Comments
Thanks, Jeff. This is helpful! I will look forward to your next VWAP lesson! KD
Would like to see how to set up multi day Vwap on tos.