

An important indicator I look to help me make trading decisions is the measure of volatility known as the VIX. The VIX is the Chicago Board of Exchange (CBOE) Volatility Index. Typically fear increases as market indexes fall. Thus the VIX will usually rise as market participants look to hedge their positions in falling stocks by buying put options that will offset their trades.
So when I saw that VXX, the tradable ETF representing volatility, was showing weakness when the market was at the lows, that gave me a hint of what the market might do next. I mean, if the market is approaching 3-month lows, why would the fear index be so weak?
The VXX is the Barclays iPath Series B S & P 500 VIX Short Term ETN (Exchange Traded Note). It is a trading vehicle that, to some extent, mimics the VIX. That is if the VIX spikes, so should the VXX. However, the VXX has a downward drift due to how it is structured.
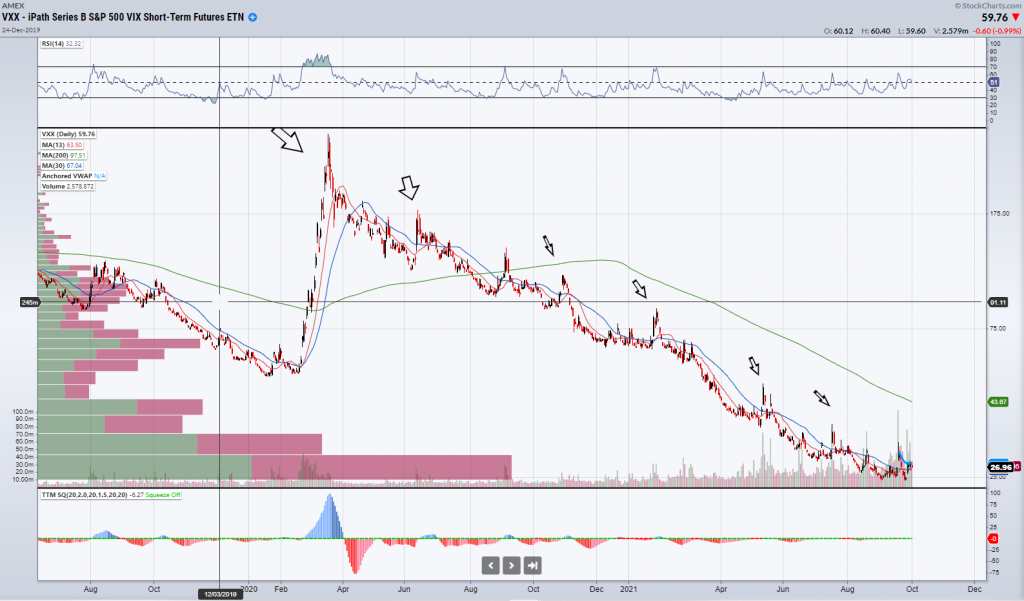
Daily chart of VXX, showing price spikes on market sell offs
Notice in the 2-year daily chart of the VXX that after it has volatility spikes, it trends down. As I’ve explained, that is due to the structure of the fund. Most importantly, for the most part, VXX has an inverse correlation to the SPY. Thus, the greater the fear and rate of change in the decline of prices, the greater the price of the VIX and the greater the price of the VXX in the short term (for the most part).
Relative Strength
Usually, when the SPY goes up, the VXX will go down. However, sometimes when the SPY goes up, we will also see the VXX go up on the same day. This relative strength is unusual and can flag potential future weakness in the SPY and an even further spike in the VXX in the days to come. It indicates that potentially the smart money is loading up on VXX ahead of a possible correction in SPY.
Today’s trading Opportunity- Relative Weakness.
The market has been weak this week, with the SPY down just over 3% coming into today. Yesterday we saw a significant red day with the SPY selling off $7 from high to low. Usually, on a weak day such as this, we should see a large move higher in the VXX as participants look to hedge their positions in falling stocks by buying this usually inversely related product. However, the VXX barely closed green, up 2 pennies. This is highly unusual. On a typical day, it “should” be up much more.
Given that the SPY was coming into some significant prior areas of potential support and made 2-month lows today, I took note of the action in VXX. If the market was going to go much lower, there should be some huge demand for the VXX. If the VXX could not break out to new highs, I would expect the market to rally. If the smart money isn’t worried and hedging their positions, it probably means they are ready to buy stocks, not head for the exit.
Let’s take a look at some charts to explain this more clearly:
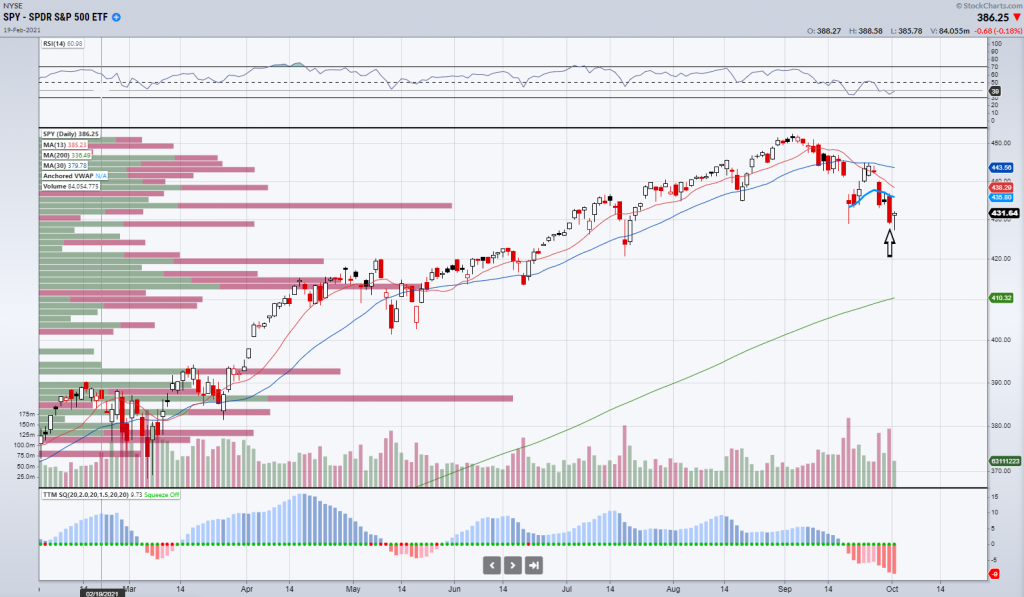
Daily Chart of the SPY
Notice how weak the SPY was yesterday
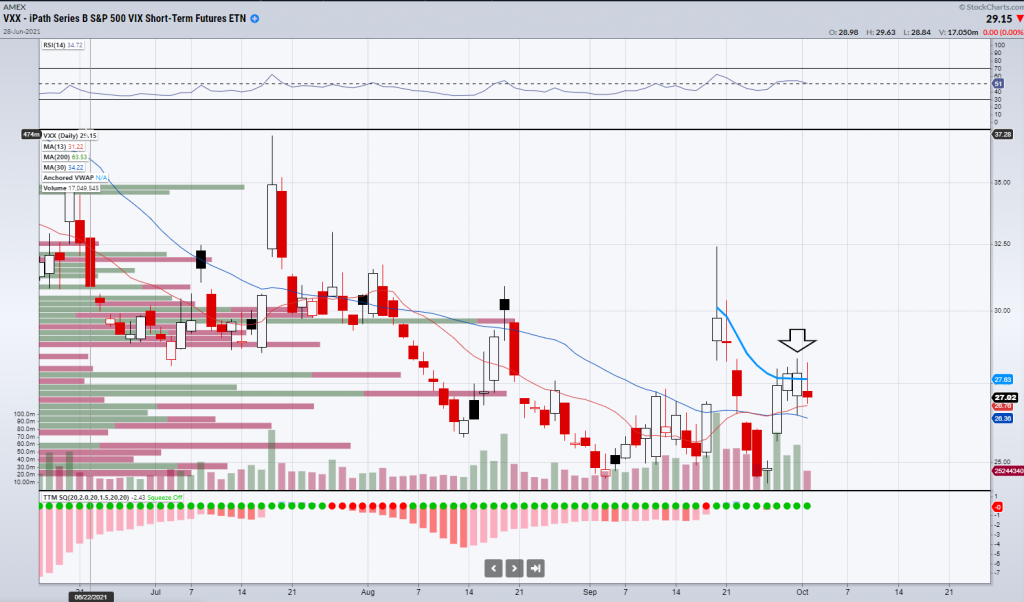
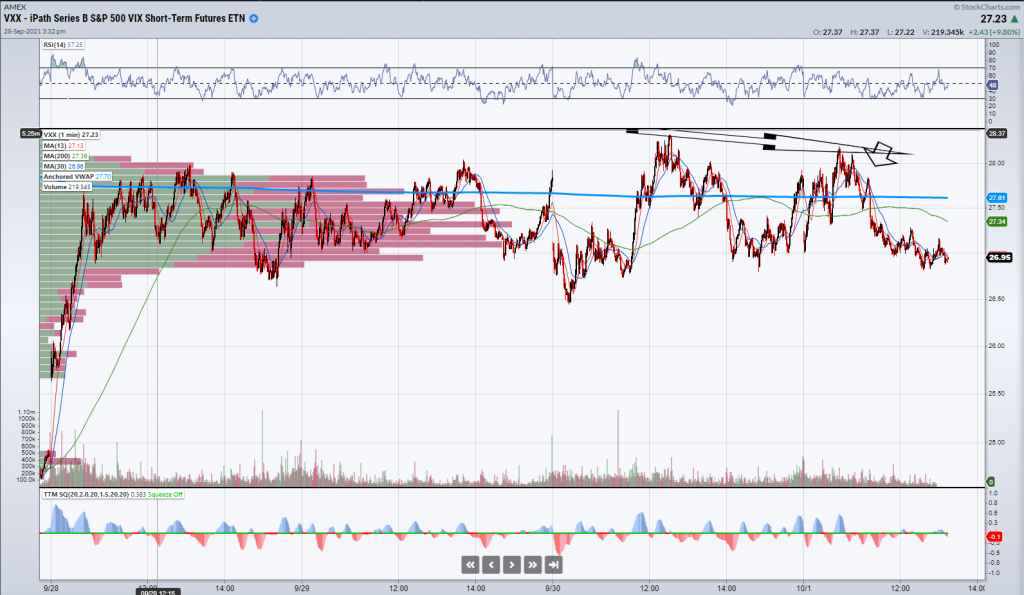
Daily Chart of VXX
Notice that the VXX has failed to break out on a day where SPY goes significantly lower. If VXX fails to break out today, that could present a good buying opportunity in the SPY. Let’s look at today’s action on a lower time frame!
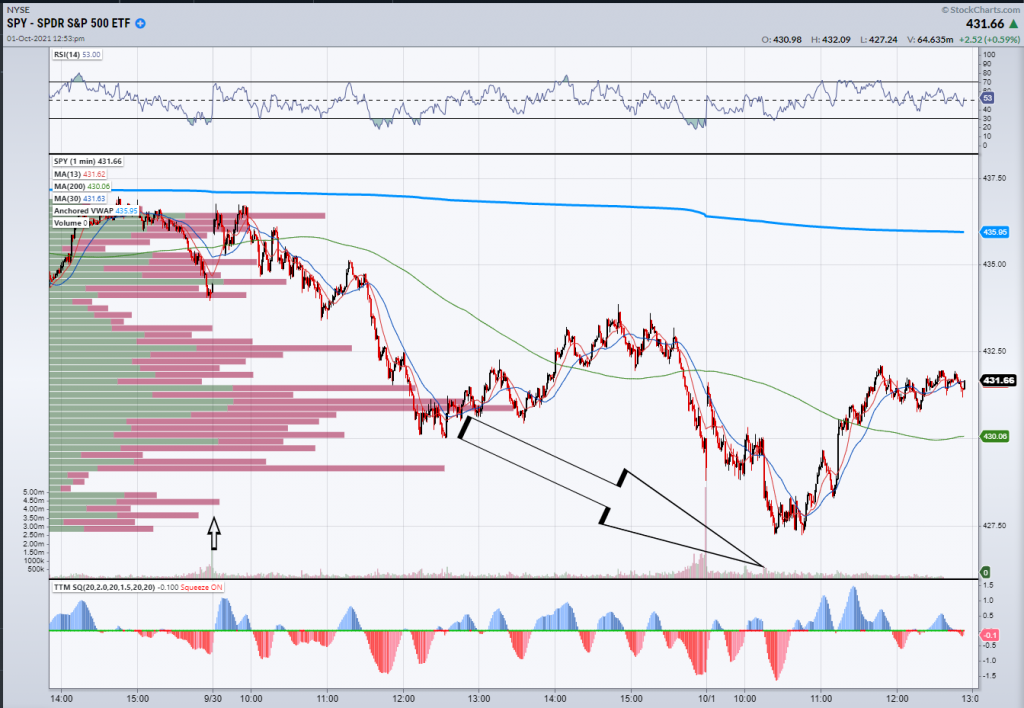
Notice how the SPY breaks down to new lows below yesterday’s support in the pic above, but the VXX fails to break out to new highs in the pic below. This type of divergence gives me extra confidence to buy the dip! If the smart money isn’t panicking, why should I? A $4 bounce in the SPY ensued.
Bottom Line
The VXX is an exchange-traded product representing volatility like the VIX. Usually, when the market goes up, VXX goes down and vice versa. I look for divergences in this action as it can help me make trading decisions. These divergences are known as relative strength and weakness. Yesterday, I noticed relative weakness in the VXX. This gave me added confidence to be able to get long the broader market and my favorite market stocks today. When the VXX failed to break out, the market did, in fact, bounce as anticipated.


3 Comments
Good!
Really good and insightful analysis Jeff. Thanks!
Hi Jeff,I really grasp upon receiving any technical strategies and please just keep sending us refreshers to enable us at performing throughout this crazy market .Thanks