

In the wake of the Federal Open Market Committee’s (FOMC) widely anticipated meeting this past week, the yield on the benchmark 10-Yr Treasury contract has begun to break out of a near-term base.
Though it is not a commonly covered topic here, I like to highlight what’s going on in the bond market when the potential for a large move in rates is elevated, as this could cause a major shift in leadership across numerous equity sectors.
When commenting on these prior articles, some of our readers have expressed interest in learning more about the basics of the bond market.
Therefore, today’s discussion will focus on bond market basics, as well as the implications that large moves in the bond market can have on many of the sectors that we not only love to trade, but often do not give much consideration to.
Bond Market Basics
Before we begin, I should mention that some aspects of the bond market, particularly some of the math involved, can be incredibly complex.
So, for today’s discussion we’re going to stick to the very basics of how bonds work, how they are different from stocks, and some of the key market-related implications.
What is a bond?
A bond is a type of investment that represents a loan between a borrower and a lender.
For today’s discussion, you are the lender (known as the investor or creditor) and the borrower is the US federal government (known as the issuer).
The issuer promises to make regular interest payments to the investor at a specified rate (the yield) on the amount it has borrowed (the face amount) until a specified date (the maturity date).
In today’s example, when discussing the benchmark 10-Yr Treasury Note, we’re talking about a loan of 10 years in duration.
Other popular loan durations are 30 years, 5 years and 2 years.
Once the bond matures, the interest payments stop and the issuer is required to repay the face amount of the principal to the investor.
Because the interest payments are made generally at set periods, bonds are often called fixed-income securities.
How are bonds different from stocks?
Bonds are known as debt investments, while stocks are equity investments, since the purchase of a stock’s shares makes that investor a part owner of the corporation.
Although corporations can also issue bonds (i.e.,debt investments), bonds, in general, do not provide an opportunity to share in the profits of the corporation.
Stockholders, on the other hand, are entitled to receive a portion of the profits and may also be given voting rights.
Bondholders earn interest while stockholders typically receive dividends.
Both may experience capital gains or capital losses if the price at which they sell their holdings is, respectively, higher or lower than the price at which they bought them.
Because bondholders are creditors of a debt agreement rather than part owners of a corporation, if a corporation goes bankrupt, bondholders have a higher claim on assets than stockholders.
While this results in added security to the bond investor, it does not completely eliminate risk.
How should price movement across the US Treasury market be translated?
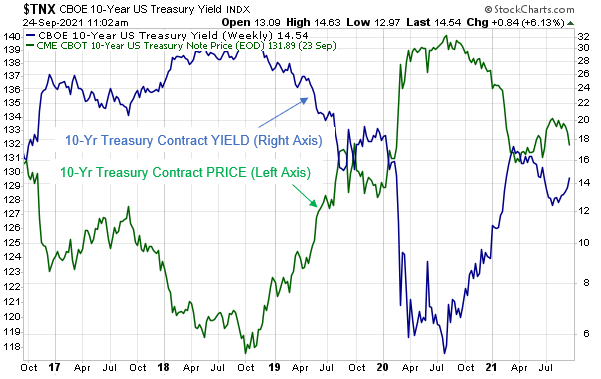
From a market perspective, when the price of US Treasury contracts like the widely discussed 10-Yr Treasury contract rises, the yield on that contract falls.
Conversely, when the yield on that contact rises, as it has been in recent days, the price of that contract falls.
This is shown on Figure 1 below, which is a weekly chart of the 10-Year Treasury yield vs. the 10-Year Treasury contract price.
Figure 1
Interest rates are starting to rise again
The recent rise is due largely to a combination of inflationary pressures in the market and the Federal Reserve’s recent discussions about moving closer to tapering its bond purchase program, which had been put in place to help keep the yields on these Treasury contracts low to help promote borrowing during post-COVID 19 economic weakness.
While inflationary market rotation is good for some sectors, and we’ll discuss those in a moment, it is not friendly to the large tech companies and other popular growth companies that so many of us have loved to trade in recent years.
Perhaps two of the most important drivers of intermarket cycles are the US dollar and interest rates.
Fluctuations in both can have either beneficial or detrimental effects on the earnings power of a wide swath of companies.
For example, a strong dollar can hurt large multinational US-based companies because it raises the cost of products provided by these companies, thereby making them relatively unattractive vs. those of foreign competitors whose goods have fallen in price as a result of their currencies being depressed by the rising dollar.
Another example, and one that is at the core of today’s discussion, has to do with fluctuations in interest rates.
So, why is it a potential concern that the yield on the benchmark US 10-year Treasury contract has been on the rise recently?
Well, the primary concern is if inflationary pressures are indeed set to accelerate, it would cause interest rates to rise rather sharply.
As Figure 2 reveals, large fluctuations in interest rates have been the key driver behind periods of leadership and underperformance by two important sectors, tech and financials.
In addition, as the bottom panel shows, interest rate cycles carry a lot of weight in the relationship between smallcap and largecap growth stocks.
Figure 2
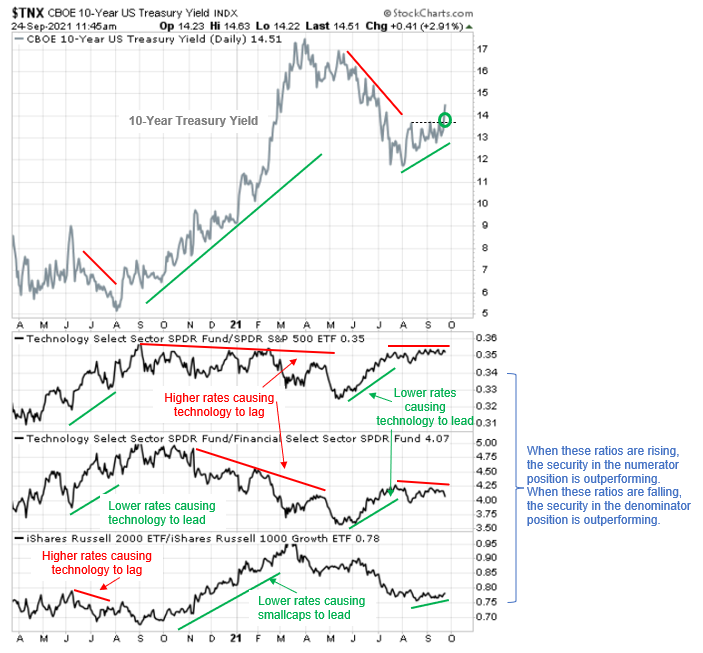
There are other sectors that have been affected by these gyrations; however, these are the two sectors that we’ll be focusing on today.
How do interest rates affect stocks in these sectors?
Large growth stocks like those that influence the movement of NASDAQ -100 ETF (QQQ) are valued based on future discounted cash flows.
Therefore, if stocks are valued based on future discounted cash flows, and the discount rate is zero, then it doesn’t matter if investors see that money one month from now or 10 years from now.
Of course, interest rates are still just one, albeit an important, part of a complicated equation. An equation that uses more than just hypothetical future cash flows and today’s discount rate.
When it comes to financial stocks, the explanation is perhaps easier to understand.
In layman’s terms, when interest rates are higher, banks make more money by taking advantage of the difference between the interest banks pay to customers and the interest the bank can earn by investing.
How can traders monitor this rotation?
To monitor these developments on your own, it is always good practice to chart the relative strength ratio between a tech-heavy index like QQQ or XLK (S&P 500 Technology sector) vs. the benchmark S&P 500.
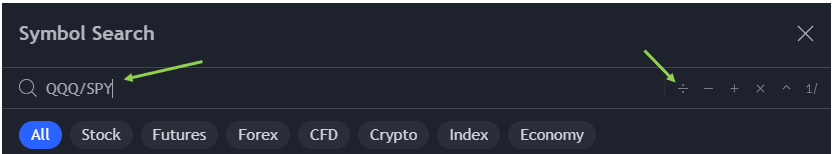
To do this in Tradingview, enter the first ticker (in this case QQQ) then select the division sign (see Figure 3 below), then enter the ticker for the benchmark (in this case SPY for the S&P 500).
Figure 3
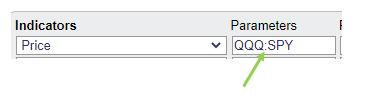
To do this in Stockcharts.com, enter the first ticker (in this case QQQ) then type a colon (see Figure 4 below), then enter the ticker for the benchmark (in this case SPY for the S&P 500).
Figure 4
Conclusion
When markets are witnessing a trend transition, it is a process that can take several days-to-weeks to play out.
Right now, as this transition process in interest rates continues to unfold, traders should avoid overweighting large, growth companies like the big tech companies so many of us have loved trading over the years.
Failure to heed this warning could lead to missed opportunities elsewhere as positions stagnate vs. the sectors that are slated to benefit from this rotation over time.
As we discussed in this commentary, those sectors are small cap companies and financials.


2 Comments
LOVE the lesson and commentary Jeff. This brings to mind a recent psychology article (1999) titled “Dunnung – Krugger effect”. Simply put “you don’t know what you don’t know”. Deep reading reveals that many people believe they are intelligent and they really are NOT, not even close!!!
This “read” should definitely be a part of any person considering trading(with Douglas) as it really shines a light on self introspection. AS ALWAYS, you provide great lessons and food for thought. 🙂 thahns, Steve
Thanks for the sensible critique. Me and my neighbor were just
preparing to do a little research about this. We got a grab a book from our area library but
I think I learned more from this post. I am very glad to see such excellent info being shared freely
out there.