👋High Alert Members do the talking
Real Experts. Real Trades. Real Profits

I’m excited to share my trade plan and thoughts with you today.
Sometimes I find a setup that is just picture perfect.
I am not saying it will be a winning idea or the perfect trade.
No, I mean that it is, technically speaking, a beautiful chart pattern straight out of a textbook. As a result, this makes for a great teaching and learning opportunity.
I am excited to share the chart and trade plan with you, and I’m just as excited to dive deeper into the technical analysis and talk about the specifics of the chart pattern.
I want you to understand the pattern and technical analysis because setups and charts repeat themselves in the market.
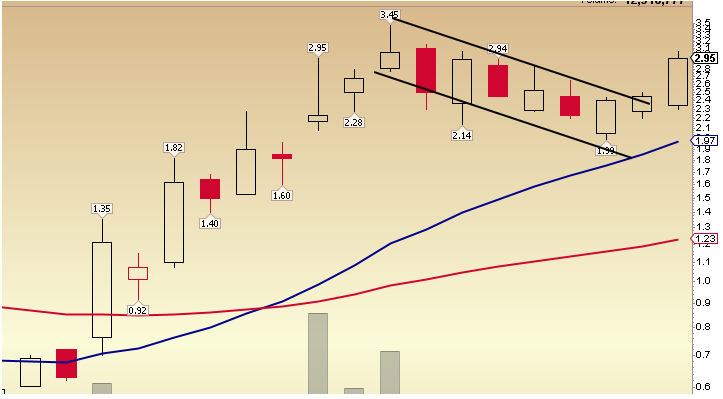
What is a Bull Flag?
A bull flag forms in a stock that is in an uptrend. Think of that uptrend as the ‘pole.’
Then, near the highs of the short-term uptrend, the stock consolidates and forms a flag pattern. Think of that as the flag on top of the pole.
This pattern might signal further continuation in a stock, especially if the stock breaks above the flag’s resistance.
The above bull flag example is a screenshot of the stock on my watch list.
I told you, gang, it is a textbook example of the bull flag pattern!
So, without further ado, let’s get started.
Kaival Brands Innovations (KAVL)
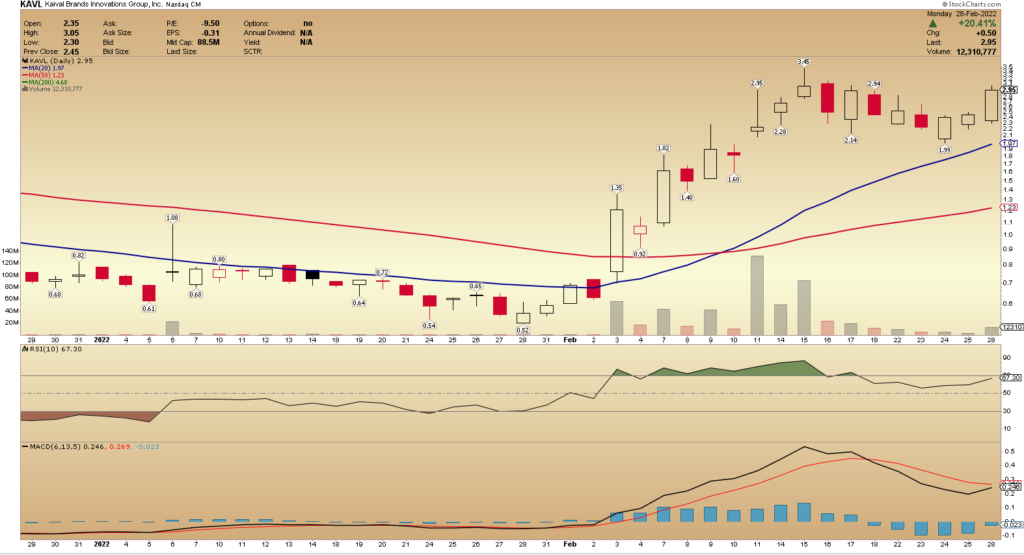
The above chart, from stockcharts.com, shows KAVL over two months.
In that period or year to date, the stock is up 295.81% and was up 431% last month, according to Finviz.
Those are some pretty hefty stats, and they correspond with the chart.
Since breaking out above $0.80 last month, the stock has not looked back and reached a short-term high later in the month of $3.45.
What is KAVL?
According to Yahoo, KAVL distributes electronic nicotine delivery systems (ENDS Products) and related components in the United States. The company offers Bidi Stick, a disposable and tamper-resistant ENDS Product in various flavor options, and Bidi Pouch, a tobacco-free nicotine formulation containing natural fibers and a chew-base filler in different flavors.
Key Stats, from Finviz:
Market Cap: 87.4M
Float: 13.15M
Short Interest: 26.70%
Average Volume: 9.36M
One thing that stands out to me from the above stats, gang, is the short interest.
The short interest of 26.70% is high.
That means that 26.70% of the 13.15M float is positioned short right.
Bulls might like that stat because it could mean that if the stock continues to push higher, the chances of a short squeeze become more likely.
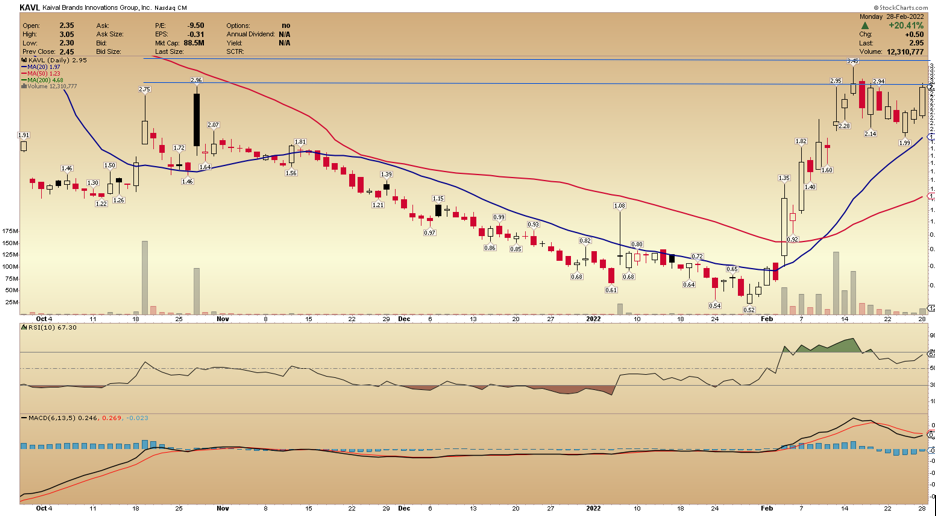
It looks like the pullback from the high and the bull flag pattern might have finished developing, and the stock is now attempting to have another leg to the upside.
I am keeping it straightforward with my thoughts and game plan here, gang.
First, I want to see the stock hold above yesterday’s high.
Secondly, I want to see the stock break above $3 and, importantly, hold above that level.
If the stock can do that, I might enter a long position and target $3.50s conservatively and a more ambitious target of $4.
The Bottom Line
This stock certainly has the look, in my opinion.
However, there are no guarantees in trading.
Therefore, it’s essential always to have a detailed plan.
I always make sure I have a plan and know exactly what I want to see to enter a position.
As I have said before, time and time again, all I can do is to plan the trade and trade the plan.

Two days ago, I wrote about the importance of relative strength during uncertain times in the market.
In that piece, I discussed relative strength as a concept and how I am looking to identify setups that have shown relative strength versus the market.
If you need brushing up on relative strength, check out the piece I did earlier in the week.
Here’s a quick reminder of relative strength: relative strength is a strategy used to identify whether a particular stock has overperformed or underperformed versus the market or another relevant benchmark.
Sticking to the theme I previously discussed, gang, I want to provide a further example of a stock that has shown relative strength and, in doing so, has bucked the market trend over the last two weeks.
I am also eyeing this stock for a potential trade, so I will also share my thoughts and game plan!

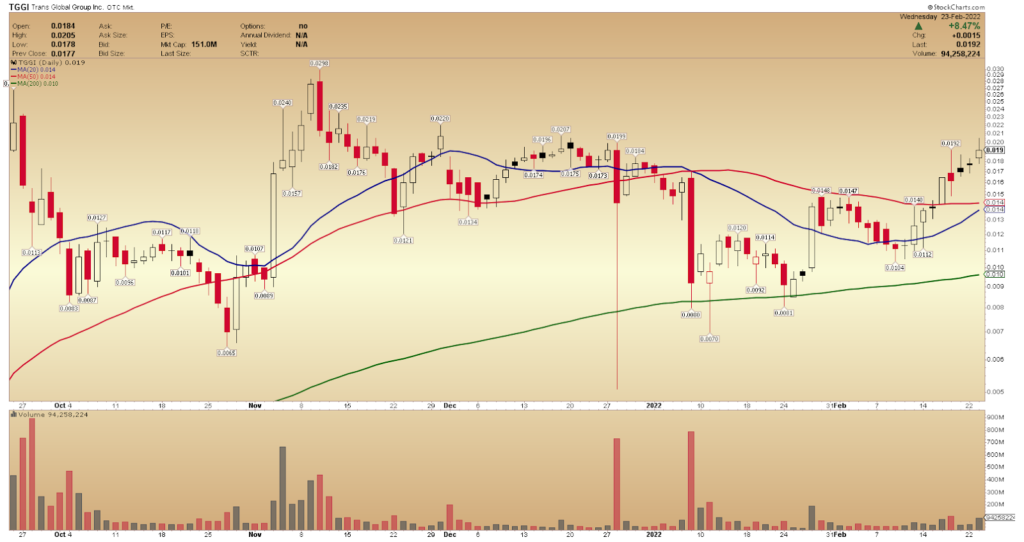
(Source: stockcharts.com)
TGGI, according to Yahoo, operates as an investment company that plans to acquire companies in the liquor industry in China. Previously, it was engaged in the general construction and renewable and solar energy sector.
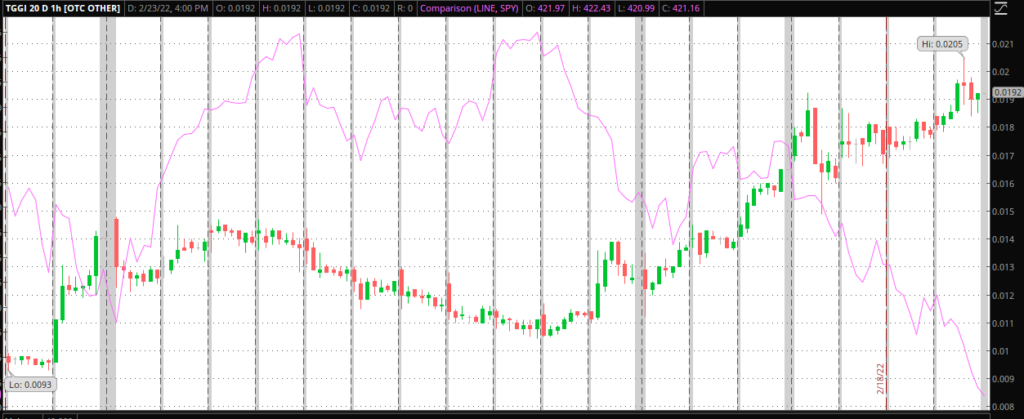
The above chart, courtesy of thinkorswim, displays the 1hr 20d chart of TGGI and the SPY price action over the same time (pink line).
As you can see, TGGI has trended to the upside during this period and remained in control by the bulls.
On the flip side, SPY has trended lower and appears to be controlled by the bears for the time being.
The overlay of the two charts above paints the picture, gang.
I can see that in the short term, shares of TGGI have bucked the market and shown relative strength.
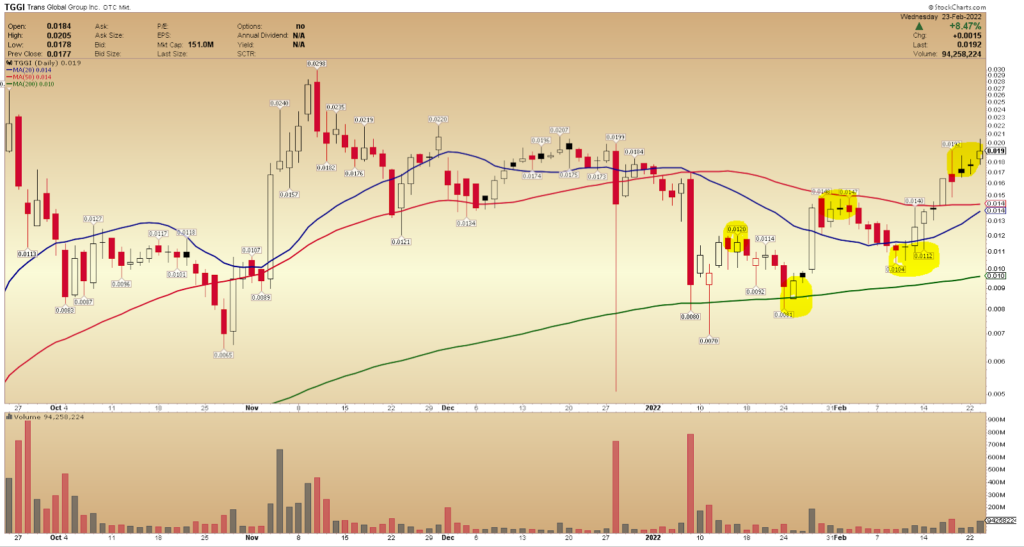
From a purely technical standpoint, a few things of interest stand out to me.
I like how the stock has traded above the key moving averages and held above.
I also like the higher highs and higher lows that the stock has recently developed, highlighted yellow.
So, gang, considering the above, I am now looking for a potential entry around $0.016 to $0.0175.
I have that area in mind because I am looking for the stock to continue to put in higher highs and higher lows.
If the stock can confirm another higher low, I might look to enter and target the next level of resistance around $0.022 – $0.024.
As I have mentioned before, I like to keep things simple during these moments of volatility and correction in the broader market.
This is just one way and one strategy I use to keep things simple.
By focusing on small-caps that are seemingly uncorrelated to the broader market’s performance and displaying relative strength, I might be able to catch breakouts and momentum in a market that is trending lower.
It might be a shortened week in the stock market, but with the flurry of breaking news and upcoming events this week, it probably won’t be a dull one!
As a day trader, I like to be up to date regarding breaking news and events that might impact the stock market and overall trend.
Especially this year, it has so far proven to be critical.
Headlines surrounding inflation, interest rates, COVID19, the Russia Ukraine tensions, and more have had and might continue to impact the stock market and economy significantly.
Yesterday, Russian President Vladimir Putin ordered troops into pro-Russian regions of eastern Ukraine hours after he recognized the independence of the Moscow-backed regions.
For more on that and the latest on the Russia Ukraine crisis, click here.
That move by the Russian President seems to have further escalated the crisis in the region, with many countries now imposing sanctions on Russia.
With the possibility of a war beginning growing larger and the effect on the supply of certain goods and services, such as oil and gas, the market is currently and understandably spooked.
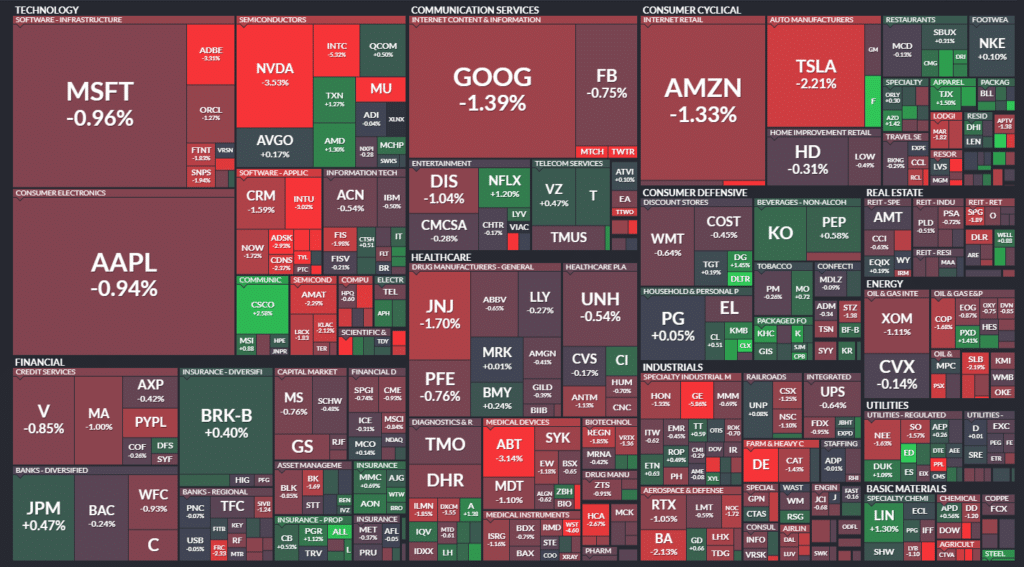
In the above map from Finviz, indicating the S&P500 stocks categorized by sectors and industries and sized by market cap, you can see that the selling pressure continued on Friday.
When writing this, the SPY was gapping lower in the pre-market.
So, gang, as I predominantly focus on small-caps and penny stocks, how does the overall market uncertainty and volatility impact my focus and game plans?
There’s an old saying in the markets, “Don’t try and catch a falling knife.”
That almost sums up what I am going to discuss below.
You see, gang, during periods of a downtrend or uncertainty and volatility in the market, I might look to play the direction in the overall market or stick to my traditional playbooks with penny stocks.
However, when I am looking at potentially going long a penny stock, I make sure that the stock shows relative strength and has one of my favorite setups.
Simply put, relative strength is when you compare two or more stocks’ performance and identify the difference in strength between them.
For example:
If you recall, last week, I did a trade recap for UVSS and went over the higher high higher low set up in the stock.
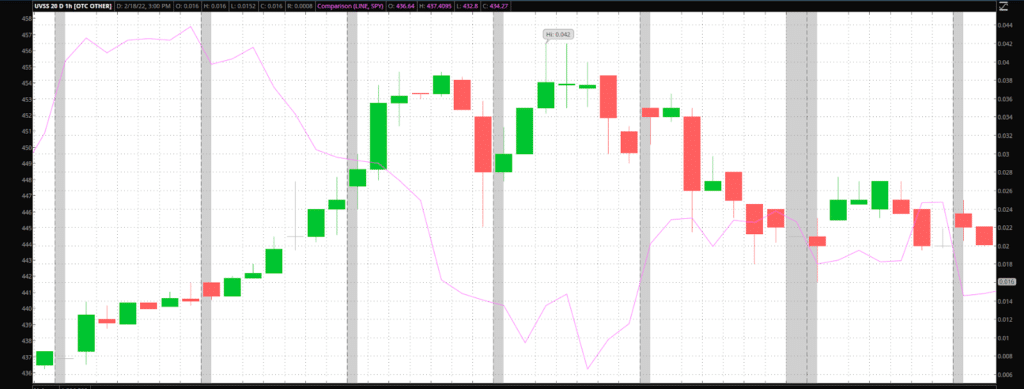
Well, let’s refer back to the chart of UVSS, from the period when I made the trade.
Except for this time, I will overlay the chart with SPY (pink line), courtesy of the thinkorswim platform.
In the above chart, you can see that when UVSS was trending higher, the overall market (pink line) was trending lower.
Therefore, UVSS was uncorrelated to the market and displayed short-term relative strength during that period.
These are the type of setups that I look for during a period of market uncertainty and selling pressure.
The Bottom Line
So, gang, to summarize the above: In a weak market, I don’t attempt to purchase short-term weak penny stocks that are not displaying relative strength to the overall market.
Instead, I focus on identifying penny stocks that display defensive characteristics and signs of bucking the overall markets trend.