What a crazy week so far, and it’s only Wednesday!
In the current environment, I am noticing many small-cap stocks put up impressive gains daily.
It’s an environment where I am expanding my bandwidth and looking to be involved in more stocks.
However, if you are new, I would suggest that you might want to focus on fewer stocks each day and emphasize focusing on higher quality setups over quantity.
It can be easy to let the excitement and craziness overwhelm you if you’re new and potentially lead to sub-par decision making and trading.
I like to alert my Biotech Breakout members to a few high-quality setups and ideas each day.
Two days ago, I sent out my Biotech Breakouts Trade Plans to my members, where I mentioned TCDA and outlined my game plan for the stock.
The stock has since made an impressive move higher after breaking out of a consolidation.
I think this is a fantastic opportunity to review a stock on my Biotech Breakout Watch List.
Tricida Inc (TCDA)
According to Yahoo, TCDA operates as a pharmaceutical company. It focuses on developing and commercializing TRC101, a non-absorbed orally-administered polymer phase 3 trial to treat metabolic acidosis in patients with chronic kidney disease.
Over the last two days and on the week, the stock is up 51.81% and 98.26% on the quarter.
Market Cap: 394.67M
Float: 49.09M
Short Interest: 3.58%
Average Volume: 208.26K
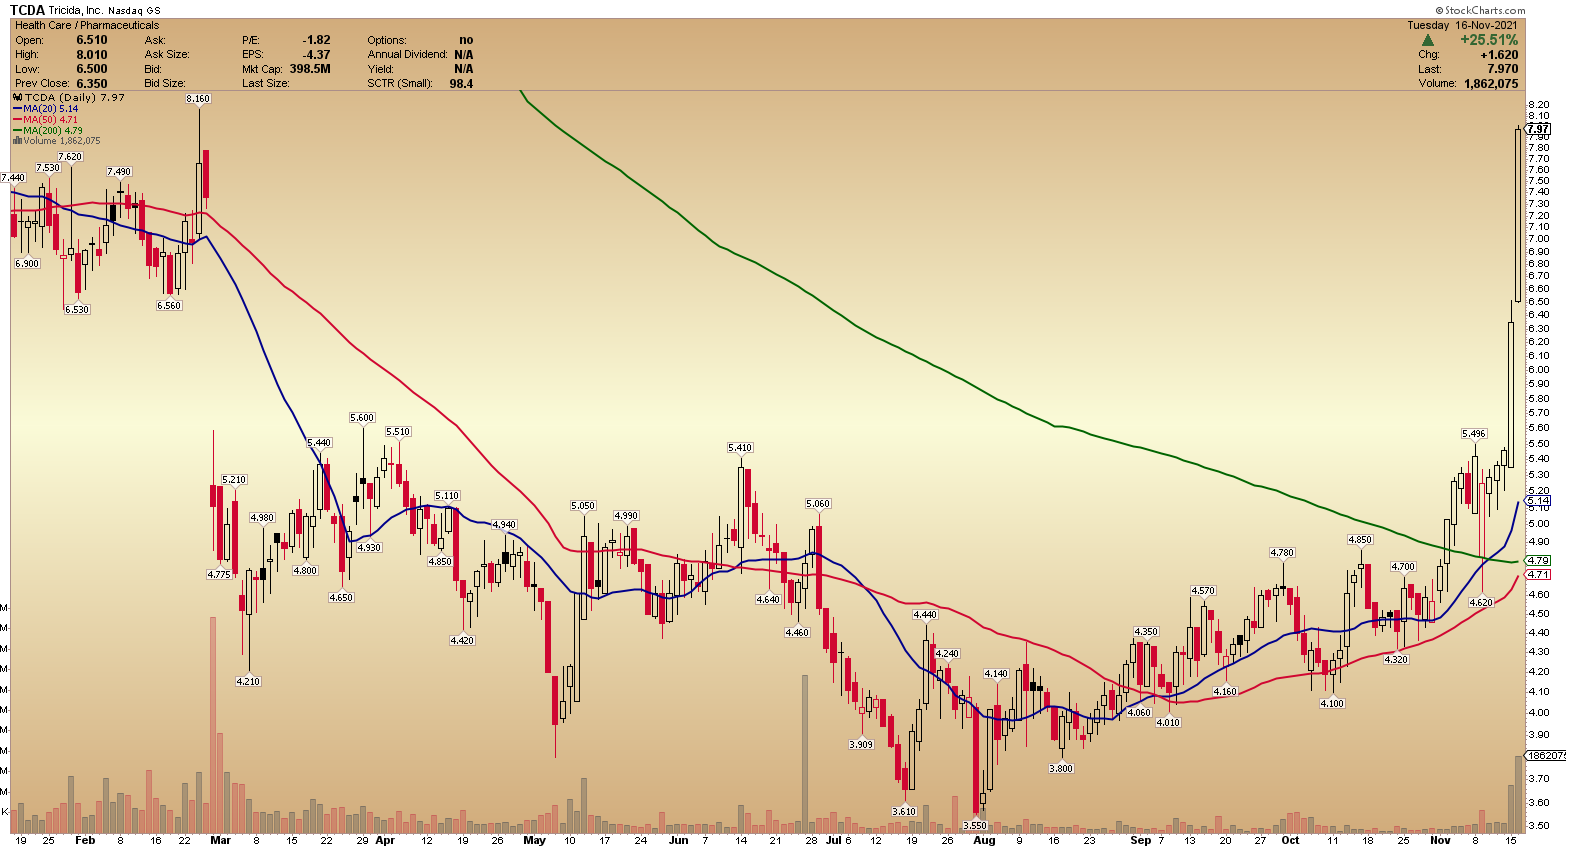
The stock spent a significant amount of time consolidating below $5.50, with $5.50 acting as critical resistance.
Since gapping down around March this year, the stock has traded between $5.50 and $4.
As the stock approached critical resistance, I began paying closer attention to it, noticing the consolidation breakout pattern and increased volume.
On the 15th of November, two days ago, I said the following to my members on the Biotech Breakout Mid-Day Watch List:

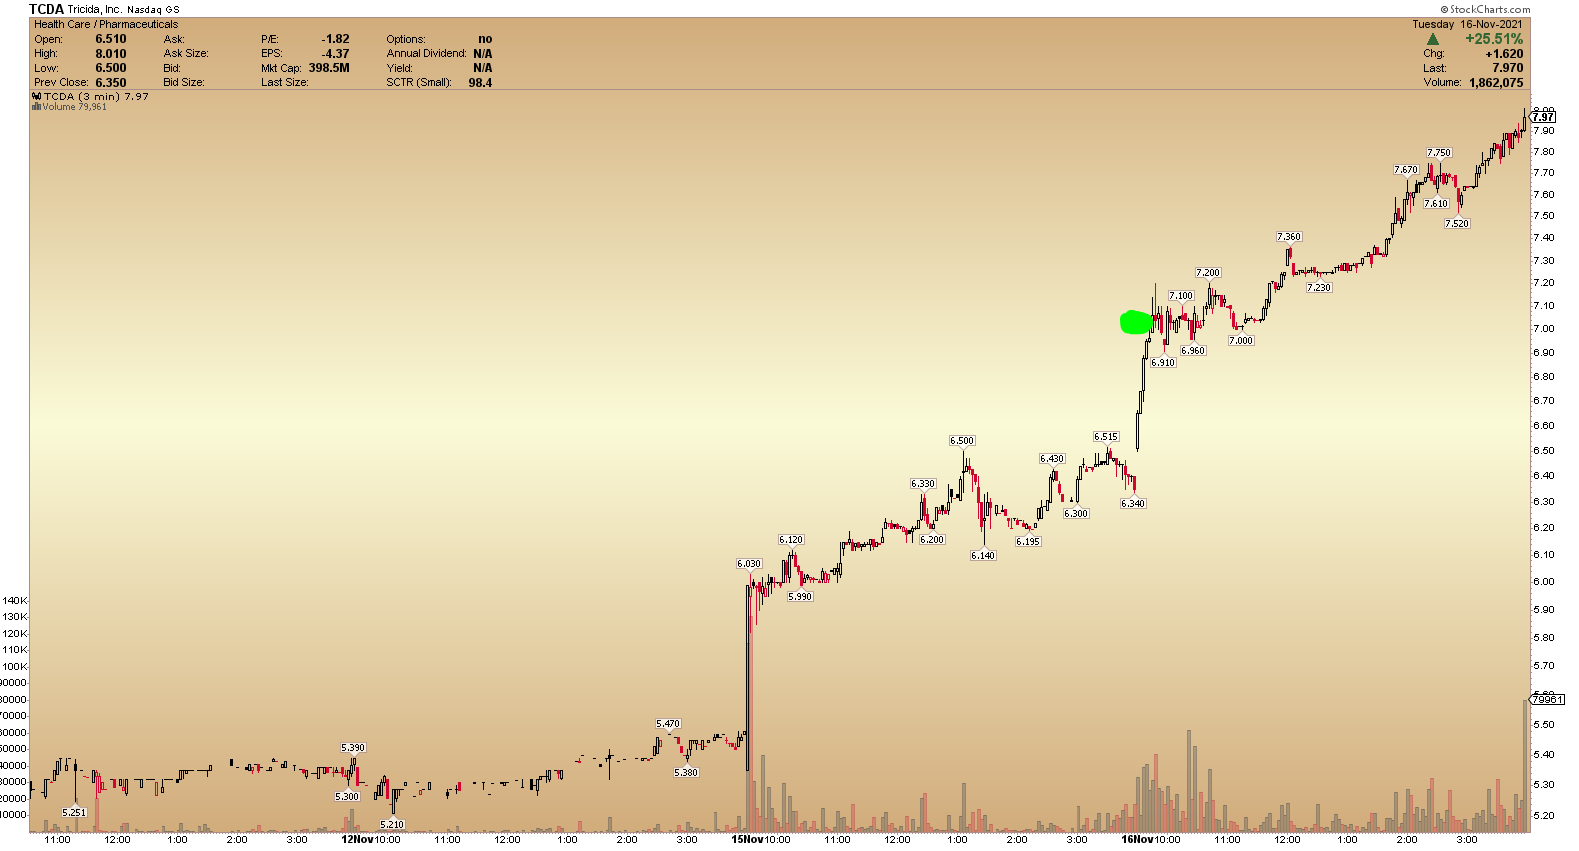
Two days ago, after the stock broke out on volume, I was looking for pullbacks and higher lows in the $5.50 area.
Unfortunately, the stock did not pull back to those levels. However, it did make a series of higher lows and formed an uptrend.
The consecutive higher lows that were made might have been solid long entries as the stock showed strength and formed a bullish uptrend.
I planned to have a stop at $4.90, as this is where I would have been wrong in the trade.
My target was $7 as this was the gap fill area (green dot on the chart above).
The Bottom Line
This was a favorable risk: reward set up, and one which I was able to identify and share with my members in real-time as the breakout was taking place.
The volume and momentum experienced in the stock were nothing short of impressive, as the stock was able to reach my target area and close the gap the day after breaking out.
Overall, this is an excellent example of a consolidation breakout pattern resulting in a gap fill.