
Hope you’re having a great fourth of July!
When it comes to trading, there is certainly no shortage of strategies to choose from.
Whether you’re an adrenaline junky that loves to scalp several trades per day, or a less active trader that prefers to trade large pattern breakouts over the span of several days-to-weeks, modern-day traders have an amazing selection of tools available to help them be more successful.
One popular method of trading involves entering trades in anticipation of an upcoming event.
Sometimes this means entering a position weeks ahead of time, often before the market’s collective opinion has come together enough to form a recognizable pattern.
In such instances, it pays to know how to use tools that clearly display where key supply and demand points lie.
I’m not talking about simple moving averages or prior price congestion levels.
I’m talking about taking an existing trading tool, pumping it full of steroids, and using it to help you identify quantitatively-enforced entry points in preparation for pre-event runups.
Do you want to be a “prepared” trader or a “dangerous” trader?
Traders who learn to read price action are what can be considered “prepared” to survive in the market.
Traders who learn to quantify where price action combines with volume to forge high probability turning points, however, can be considered “dangerous.”
VWAP on Steroids
After being widely used by professional traders for decades, the volume weighted average price (VWAP) is a trading tool that has grown in popularity among retail traders in recent years.
Though quite effective when used properly, VWAP does have some limitations.
Most notably, most charting systems only allow you to construct the VWAP based on the average price a security has traded at throughout the day or the past week.
While this is great for day traders, it falls short of what longer-term position traders need to identify key volume-weighted price points constructed from several weeks or even months of data.
Enter the Anchored VWAP.
To reiterate, traditional VWAP calculations always start with the first bar of the day and end with the final bar of the day.
Anchored VWAP, on the other hand, allows you to pick a specific point from where the trader would like the calculation to begin.
Why is this leaps-and-bounds better than the traditional method?
Because it allows the trader to create a running measure of supply and demand from a recent turning point in the market.
In other words, from an area where there was a noticeable change in market psychology.
This can include a major price pivot, or event (e.g., Presidential election), or seasonal starting point (e.g., Y-T-D).
Again, for position traders who prefer to capture multi-week price swings, this method is superior to simply following a simple VWAP line that arbitrarily starts at the beginning of any given day or week.
Let’s see how it works
For today’s example, I’ve applied the anchored VWAP to one of the stocks that Kyle Dennis and I have been tracking.
In this example that I am about to show you, I’ve applied the Anchored VWAP tool to a price setup that I call an “in betweener.”
What’s an “in betweener” setup?
That’s when a stock is sitting between two major price levels and waiting for a break in either direction.
On Friday, shares of ALEC exploded higher on news that GlaxoSmithKline Plc agreed to pay the company as much as $2.2 billion to develop therapies targeting diseases such as Parkinson’s and Alzheimer’s.
Prior to this announcement, the chart below shows that ALEC had paused below a possible double top formation but was still trending higher against the VWAP that had been anchored at the most recent pivot bottom.
Figure 1
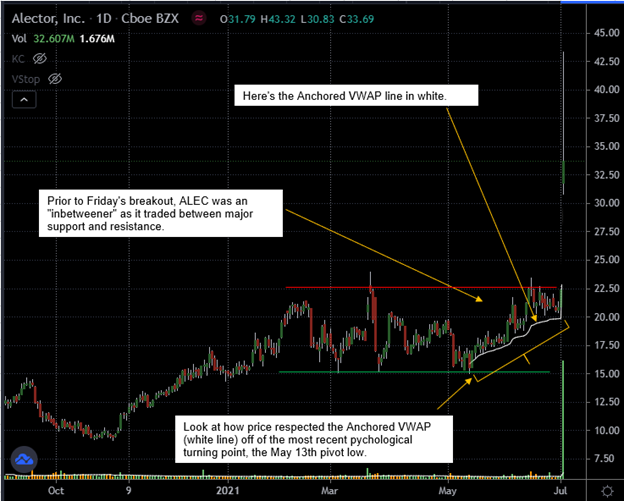
In situations like this, where price is running up ahead of a catalyst, it’s common for there to be very little opportunity for traders to be able to buy a pullback due to the pre-event demand for the stock.
That’s why I chose to anchor the VWAP at the most recent major pivot low on May 13th, as this represented the most recent psychological turning point ahead of the upcoming event.
Think of it this way, if the demand that powered the reversal higher from the May 13th low is to continue to feed the ongoing uptrend in price, then price has no business falling below this Anchored VWAP line.
Armed with this knowledge, a trader can use this line as his or her stop-out point when trying to building a long position against it.
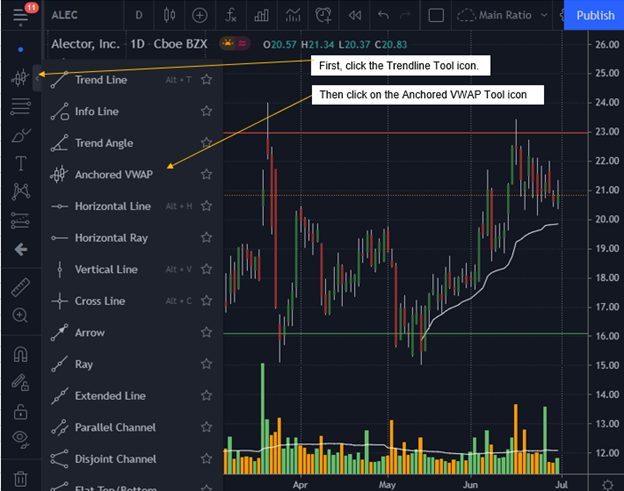
Where can traders find the Anchored VWAP tool?
Now, I am using the free version of Tradingview’s charting application to create these charts.
However, the Anchored VWAP can also be found on many of the major brokerage platforms like TD Ameritrade’s thinkorswim.
Within Tradingview, to find the Anchored VWAP tool, you’ll simply need to click on the “Trendline Tools” in the left-hand menu bar, then click on the Anchored VWAP icon as shown below.
Figure 2
From there, to start practicing how to use this line to find meaningful levels of supply and demand (i.e., support and resistance), just click on the day that you want to anchor the VWAP at.
Remember, the anchor point can either be a major price pivot, a past earnings date, the Y-T-Date starting point, or the date of a major news event. The key is that whichever date you choose should mark the start of a noticeable change in psychology (e.g., the start of a meaningful trend). Note: this tool can also be used on monthly, weekly and intra-day charts.


9 Comments
It’s amazing to go to see this web page and reading the views of all colleagues about this piece
of writing, while I am also zealous of getting knowledge.
I like what you guys are up too. This type of clever work and
coverage! Keep up the excellent works guys I’ve included you guys
to my own blogroll.
Thanks for the useful article.
I am really enjoying the theme/design of your
blog. Do you ever run into any web browser compatibility issues?
A few of my blog audience have complained about my website not operating correctly in Explorer
but looks great in Safari. Do you have any advice to help fix this problem?
Hey would you mind letting me know which webhost you’re working with?
I’ve loaded your blog in 3 different browsers and I must say this blog loads a lot faster then most.
Can you recommend a good internet hosting provider at a honest price?
Thanks a lot, I appreciate it!
This is very helpful! Thank you! KD
I really like reading through an article that can make people think.
Also, thank you for permitting me to comment!
I do not even know the way I finished up right here, but I thought
this publish was once great. I don’t understand who you might be
however certainly you are going to a well-known blogger if you happen to are not
already. Cheers!
I am regular reader, how are you everybody? This piece
of writing posted at this web site is really nice.