The earnings season starting in July 2021 comes more than a year after the COVID-19 pandemic started.
Investors are looking forward to strong results compared to the depressed 2nd quarter numbers of 2020.
Within a sea of thousands of stocks to choose from, how can traders find high-conviction setups heading into earnings?
I’m about to show you.
What is earnings season?
Earnings season is a quarterly period in which most public companies release their earnings reports.
Since these financial results are often instrumental in generating big swings in companies’ share prices, many traders look forward to earnings season as a catalyst event that they are sure to mark on the calendar.
Earnings seasons usually fall a couple of weeks after the final month of each financial quarter, which end in December, March, June and September.
Although it’s not uncommon for companies to report outside of earnings seasons, large companies’ releases tend to fall within earnings seasons.
Earnings announcements are released outside of market hours so that the reports reach as many people as possible and don’t interrupt the trading day.
How to find opportunities leading up to earnings?
Newton’s First Law of Motion states that an object in motion tends to stay in motion unless an external force acts upon it.
Believe it or not, this concept can also apply to stocks, and one of the ways savvy traders can exploit this phenomenon is by trading stocks that are trending heading into earnings.
You see, alternating bullish and bearish market forces cause a company’s stock price to trade around what is perceived to be its intrinsic value.
From a technical perspective, you’re probably used to seeing stocks vacillate around some moving average, such as the often used 50-day moving average.
As traders, we must learn to identify those instances when a stock’s price has the potential to overshoot its average price ahead of an important event such as earnings.
We then employ any number of trend or momentum strategies to generate returns as prices move away from the average price.
Finally, when price has moved too far away from the average, we can then switch to using mean reversion strategies with the goal of profiting if price reverts in the direction of the average.
Let’s look at an example.
These days, countless services allow you to screen for all types of trading setups, and some of them can be pretty costly.
While a good screening service is worth its weight in gold, mainly when used properly, there are ways to find pre-earnings solid trade setups for free.
You just might have to do a little more work to sift through the results for some winners.
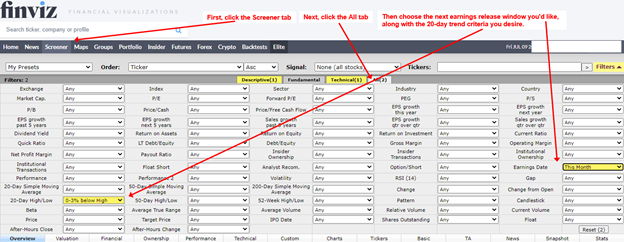
One way is to use Finviz’s free screener.
Figure 1 below shows the simple steps I took to create a basic screen that searched for stocks with earnings this month and are trading just below a 20-day high (this essentially searches for stocks that are in a strong 20-day uptrend).
Figure 1
That’s it!
And by doing this I am provided with a strong list of candidates that I just need to sift through to find the technical pattern I feel comfortable with.
One of the names I chose from this list is Johnson & Johnson (JNJ), which releases earnings on 07/21.
Figure 2 below is a daily chart of Johnson & Johnson (JNJ), with the Keltner Channel indicator and a simple 10-day moving average on the top panel, with the 14-Day RSI momentum study on the bottom panel.
Figure 2
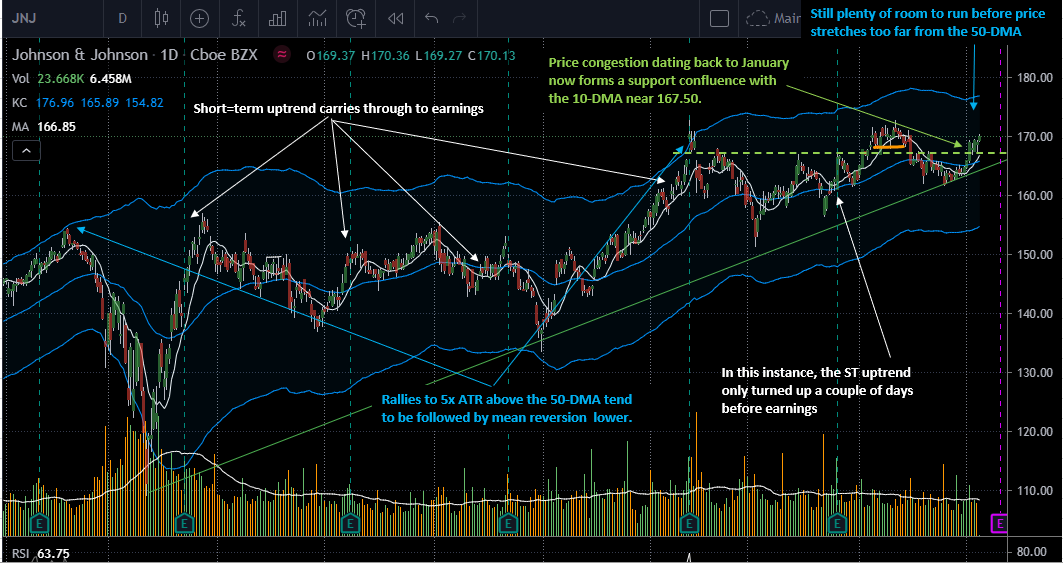
As a reminder, the default settings for Keltner Channels are typically set two Average True Range (ATR) values above and below the 20-day exponential moving average.
For today’s discussion, however, I am using a 50-day exponential moving average with 5X ATR bands to identify intermediate-term price cycles that were present ahead of past earnings reports, as opposed to the shorter-term cycles captured by the default 20-day, 2x ATR settings.
Before we continue, it’s important to recognize that most technical indicators can be adjusted to suit your trading style.
For example, for very short-term traders looking to capture 1-to-3-day swings, it’s very common to change the default 14-day setting for the RSI momentum indicator to 3 days, or the default 20-day Bollinger Band settings to 5 days.
By doing so, the shorter-term day trader is not just looking to identify the short-term trend, but also the extreme points of price displacement above or below that shorter-term trend.
Back to the current example, we can see on the chart directly below that when JNJ rallies away from the 50-day moving average, those rallies tend to become exhausted after the stock has stretched 5 ATR above the average.
How can a trader use this information to help establish a thesis now that JNJ is just 8 days away from its next earning date on 07/21?
First, the trader should be able to identify that JNJ is not only trending higher but is also well shy of being stretched too far above its 50-day moving average.
Next, a quick visual backtest reveals that in 4 of the past 5 instances, whatever the short-term trend direction was with 8 days remaining until earnings was the direction the trend continued to head up to the day of earnings.
Note: I’m using the slope of the simple 10-day moving average as my short-term trend indicator.
Of course, the past is no guarantee of future results.
But this simple backtest provides theoretical support on which a trader can create a thesis for his or her pre-earnings trade.
At its core, this thesis would be built on the following elements:
1. The trader is betting on the trend to continue higher heading into earning on 07/21.
2. In order for the trend to continue with no interruption, price should not fall below the $167.50 area, which is where the short-term moving average, recent price support and price congestion dating all the way back to January all reside.
Bottom Line
The key to becoming a successful trader lies in the ability to let winning trades run and cut losing trades short.
This setup we’ve just covered is a straightforward thesis that prices can continue to rise against a very well-defined stop-out level that, if breached, will allow a trader to identify he or she is wrong, take a small loss, and live to trade another day.