
There are many different trading indicators, all of which serve a specific purpose and are used to conduct analysis and fit within a trading strategy.
When traders are just beginning their journey, they often find themselves overwhelmed with the many indicators that exist.
Depending on what you read or who you speak to, one indicator might sound superior to another. However, the truth is that there is no right or wrong indicator. There is just one that makes the most sense to you and enables you better to understand the price action and potential trade opportunities.
I thought I would spend some time going over some of the most popular trading indicators, and hopefully, one or two resonate with you.
Moving Average (MA)
The moving average, also commonly referred to as the Simple Moving Average, is an indicator traders use to identify the overall trend.
Depending on what parameters you use, the moving average paints an overall picture regarding the direction of the stock.
The most popular moving averages, such as the 50 day and 200 day, often act as significant resistance or support levels.
The distance of the moving average to the most recent close will typically vary depending on your chosen data. For example, a 50 day MA requires 50 days of data and will be closer to the stock’s current price than the 200 day MA.
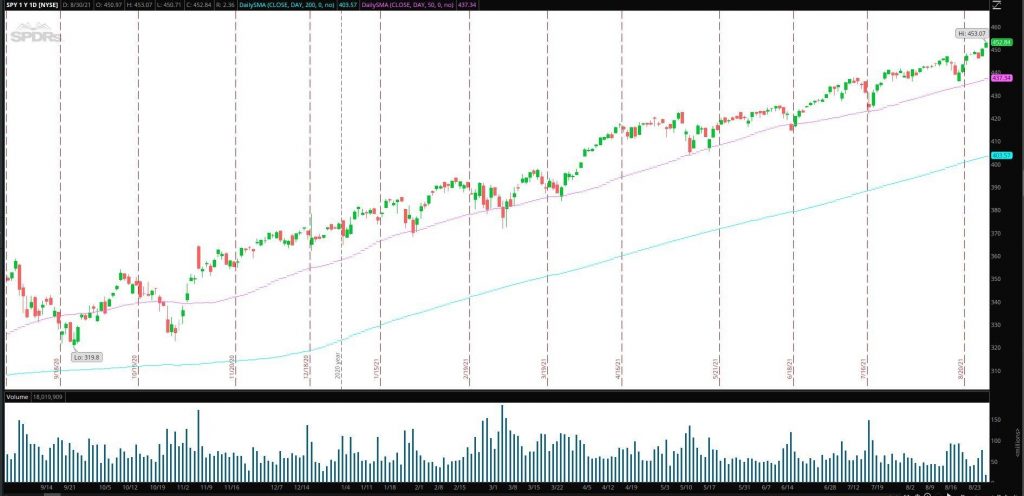
For example, in the above chart of SPY, I have placed two moving averages on the daily chart. The blue line is the 200 day, and the pink is the 50 day. From these indicators, I can see that the market has been in a clear uptrend. The chart also clearly shows that the 50 day moving average has acted as key support on more than one occasion.
Relative Strength Index (RSI)
Traders widely use this indicator to help identify possible oversold and overbought situations, market conditions, and momentum.
The RSI indicator is expressed as a number between 0 and 100. A stock near or above an RSI level of 70 is considered overbought, while a stock near or below 30 is considered oversold.
Traders use this indicator across various time frames.
For example:
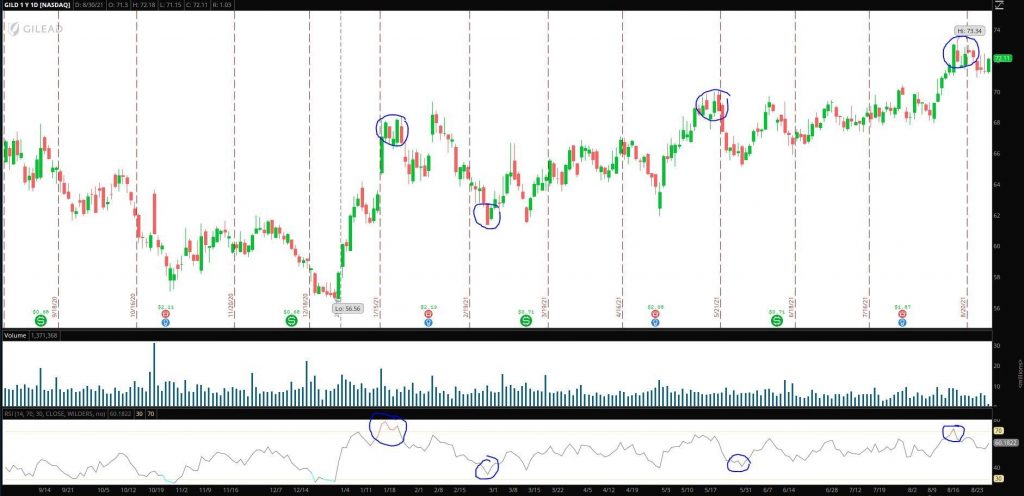
Notice in the above chart of GILD, that when the stock achieved an RSI of 70 or higher, it marked the short-term top. Similarly, each time the RSI neared 30, It marked a short-term bottom.
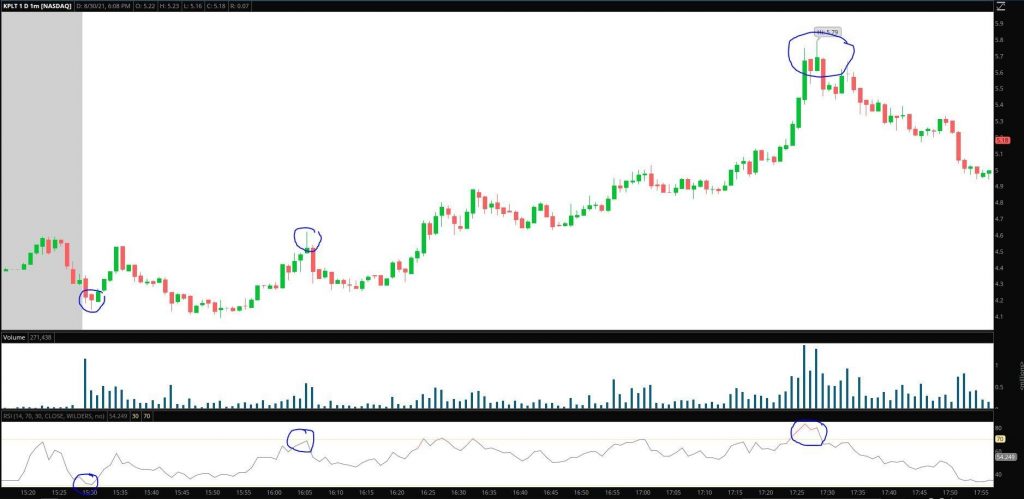
The above example shows the usefulness of the RSI intraday. Off the open, KPLT traded lower, and the RSI got below 30 momentarily, which signaled the bottom. Shortly after that, the RSI touched 70, which signaled a short-term top.
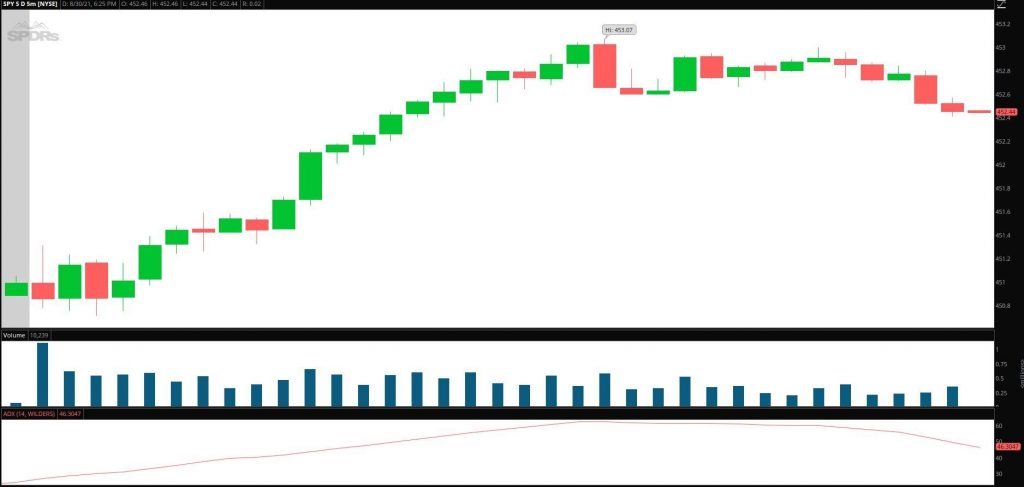
Average Directional Index (ADX)
The ADX shows the strength of the price trend. The ADX is used by traders to help identify whether a trend is likely to continue. The indicator has a scale of 0 – 100, and a stock with an ADX reading over 25 is considered to have a strong trend.
The Bottom Line
I have just scratched the surface with the above examples, as these are just a few of the most popular indicators that traders use.
Other popular indicators include VWAP, Standard Deviation, Fibonacci Retracement, and Bollinger Bands, to name just a few.
The indicator you use will be based on various factors, such as your time frame, trading style, risk parameters, and stock selection preferences.
Indicators can be used in conjunction to help you better understand the overall trend of the stock and potential opportunities.


1 Comments
THE BEST TEACHING ARTICLE