

Yesterday shares of MRNA experienced their first red day after five straight green days. Similarly, shares of BNTX pulled back after experiencing a vertical run after breaking out over $250.
Yesterday I wrote about preparing for a pullback in these two stocks, and sure enough, it played out as planned. Not because I am a stock market genius, but rather because I game planned various scenarios, and one of them played out. This is a result of technical analysis, screen time, and experience. “Fail to prepare, prepare to fail.”
The article from yesterday, precisely the plan I outlined, along with the price action in MRNA, provide me with a great case study and teachable moment.
So let’s take an in-depth look at how this pullback played out in MRNA, how it could have been traded, and what’s next for the stock.
Let’s begin with the overall sector ETF: IBB
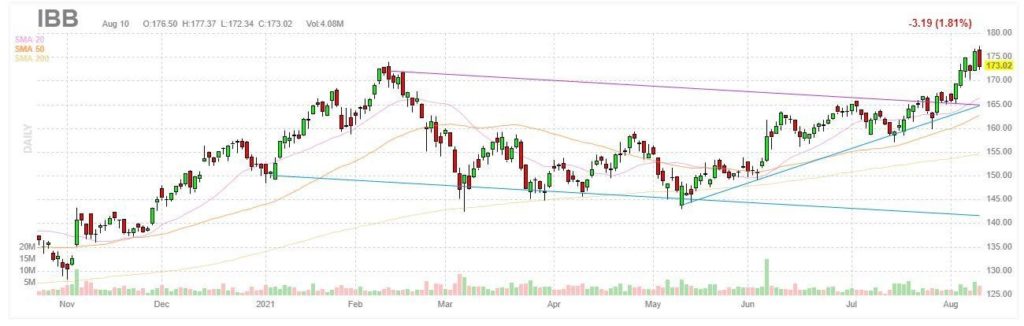
The IBB closed down 1.81% yesterday. This pullback was primarily a result of relative weakness and selling seen in some of the significant weighted stocks in the ETF, along with weakness seen across other sectors.
In the future, I would like to see the IBB stabilize and consolidate over $170 support area, which would signal strength and the possibility for another leg higher.
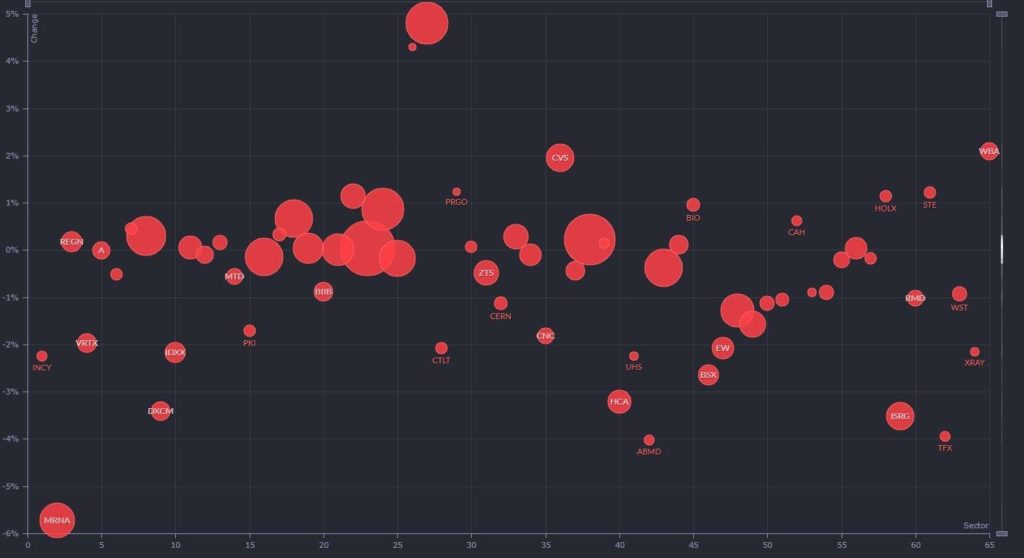
The above bubble map, from Finviz, displays S&P 500 healthcare stocks, sized by market cap, and their %performance change from yesterday.
We can see that the overall sector was dragged lower by weak performance, with most names hovering between 0% and -2.5% on the day. The main outlier is MRNA, which closed down 5.72% on the day and was the worst-performing healthcare stock in the S&P 500 index.
Moderna (NASD: MRNA)
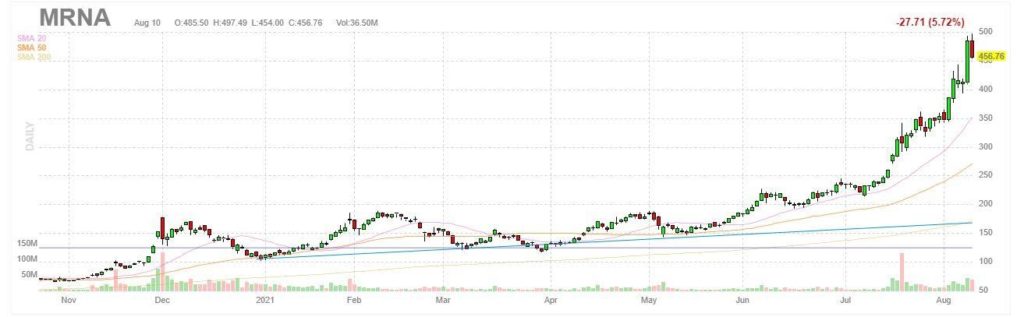
MRNA closed down 27.71 points, or 5.72% yesterday. It is just a small blip in the bigger picture for the stock, as it remains up 18.18% on the week, 90.84% on the month, and 337.22% year to date! This pullback needed to happen because nothing goes straight up or straight down forever, as I have said before. Eventually, stocks need to pullback or consolidate to digest the move.
Yesterday I explained why I thought MRNA was extended. I spoke about the extension from key moving averages and how the daily range has also begun to extend. I also mentioned that since breaking out, over $200, the shares have more than doubled, and volume has increased, which signaled a pullback was due.
The specific trade plan, which I outlined yesterday in the article, was:
“As the stock approaches $500 and likely gets above this level, it will become a significant level of interest. $500 is a key psychological level and potential resistance zone. As it is clear that the stock is in the process of going parabolic, I will be watching for signs of resistance and selling. Specifically, I will want to see price action confirm that the short-term top is in. This might happen by the stock pushing higher in a short period and then immediately failing and giving back the day’s move.”
I also mentioned that I would be on the lookout “for the stock to push higher, make a lower high, and then proceed to trend lower and go red.”
So let’s review this and see how it played out:
From my plan, I mentioned that I was looking for the following:
- $500 to act as a critical level of interest and resistance.
- Price action to confirm the top is in.
- Fast move higher and immediate failure.
- Lower high and stock to roll over.
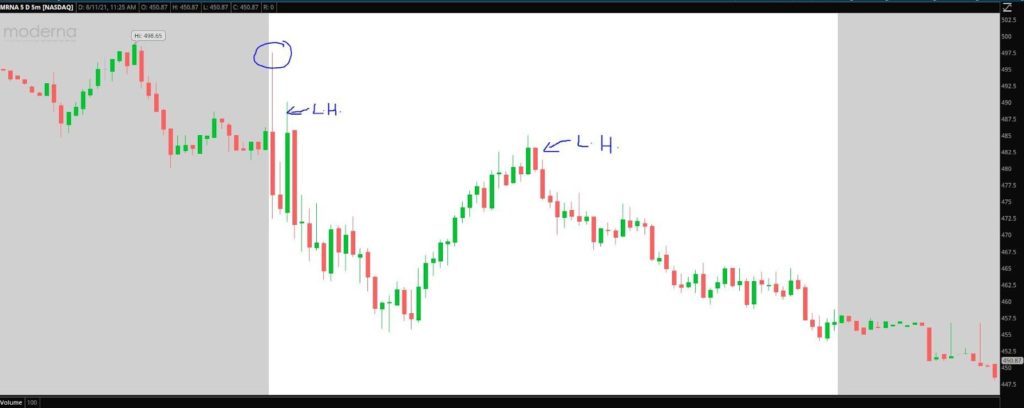
Quite frankly, it played out perfectly. The stock pushed higher off the open, coming into pre-market resistance and the all-important $500 area. It was immediately met with selling pressure and rejected this area. This was the signal. Once that rejection occurred, it served as confirmation, and a short could have been placed against the high of the day.
Based on what I had planned, next I wanted to see a lower high, which would serve as further confirmation and signal that the stock could trend lower.
Shortly after, the stock attempted to reclaim higher prices but was rejected once again (L.H marked on the chart). At this point, a short position could be placed once again, or a position could be added to on the short side.
As the stock makes a new low in the morning, opportunities could be locked in, and risk can be taken off. Once the downward trend is broken, the position could be closed after the morning low was put in at $455.30.
The stock then reversed; however, it could not hold the opening price and once more put in a lower high midday. This provided a fresh short entry offering good risk: reward. As the stock trended lower into the close, the position could have been closed out coming into the morning low.
What’s Next?
As we advance, key levels of support for MRNA are the following:
- $410 support from Monday.
- $440 support from after-hours trading on Tuesday.
If the pullback is complete, the stock will need to hold these prices and consolidate to digest the recent price action.
If the stock can reclaim $480, then there could be further upside shortly.


1 Comments
As MRNA moved lower in the afternoon, I bought the stock for several acct for long term play on custodial acct and IRA.Bought at the low of $375 -$380. Its moving higher now to $397. Need to put in trailing stop to protect profits.