
I’m about to show you something that’s going to blow your mind.
Imagine you’re considering entering a trade in anticipation of some catalyst that is several weeks away.
You want to employ some sort of options strategy to express your bullish outlook for the stock price during the runup to the event, but you have no clue how to determine realistic limits for your desired strategy so far out in time.
Well, I want to discuss the potential for using a stock’s volatility to help make more informed decisions.
Adapt or die
Before we get started, this brief discussion of statistics may seem a little overwhelming at first.
Having a basic understanding of some basic statistical concepts is essential to becoming a successful trader, though.
At the end of this brief discussion, I promise I’ll apply what you’ve learned to a trading tool that you’ve probably got a better grasp of.
The basics of standard normal distribution
The graph below shows a Standard Normal Bell Curve.
At the bottom of the graph, you’ll notice +/- 1, 2 and 3 standard deviation lines, while the corresponding 68%, 95% and 99.7% labels highlighting the amount of data that will remain within those lines is shown on the graph itself.
When we are talking about the range in which most of the price action actually occurs, it’s the 68% (1 standard deviation) zone.
Although price action certainly does move outside of the 68% zone from time-to-time, price movement that stretches 2 – 3 standard deviations happens far less often.
You’ve probably used standard deviation in past trading
If you’ve ever used Bollinger Bands, you’ve used a statistical measure of price movement.
A very common way to begin understanding how to visualize the probability that price will remain within a certain range is to apply the default 20-period moving average and +/- 2 standard deviations setting for Bollinger Bands to price charts.
Simply put, the purpose of +/- 2 standard deviation Bollinger Bands is to reflect the statistical fact that 95% of price action will remain with these bands.
Now that you have been introduced how to approach the market with an understanding of how to set expectations for future price ranges, let’s take a look at how traders can determine the probability that price should remain within a certain range over a certain period of time.
Probability Cones
Traders can quantify the future price range of a stock by using its implied volatility.
Implied volatility (IV) represents what the market thinks about the stock’s volatility in the future.
This compares to historical volatility, which measures the realized volatility (i.e., the volatility that has already occurred).
In options trading, it is a stock’s implied volatility that is used as part of the Black-Scholes Model to price options.
Sure, the math needed to forecast the future price range of a stock is a bit difficult.
Lucky for you, though, many online brokers now include the tools necessary to perform this analysis as part of their charting platforms.
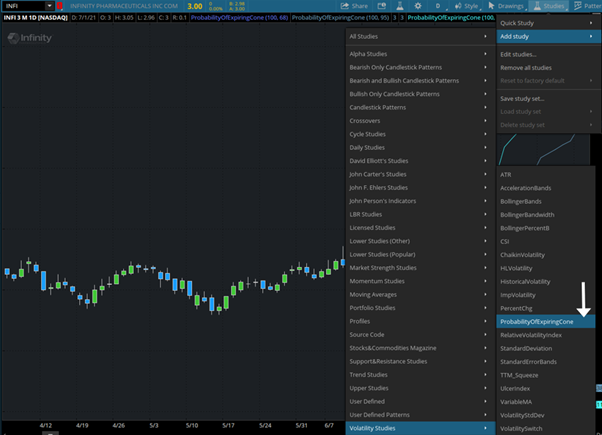
In TD Ameritrade’s thinkorswim platform, the tool is called a “Probability of Expiring Cone.”
As shown on the first chart below, in order to add this tool to my chart, I had to click studies, then add studies, then volatility studies, then select “Probability of Expiring Cone.”
Figure 1
Now, this next part is important. By doing this, I only created one probability cone, which defaults to 68% (1 standard deviations) probability.
In most cases, one cone is fine.
If, however, you want cones that represent 1, 2, and 3 standard deviation ranges, you’re going to have to repeat the step above 2 more times.
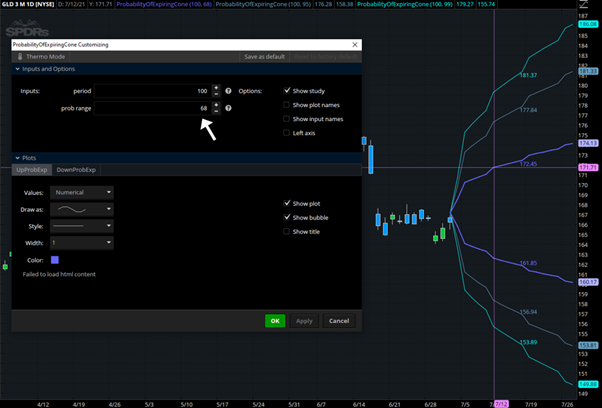
As you add the 2nd and 3rd probability cones, which will all start at 68% probability, you will have to right click on those bands to edit them.
So, after you right click on each cone you will then select “Edit Study Probability of Expiring Cone” to change the “prob range” number as shown on the chart directly below.
Figure 2
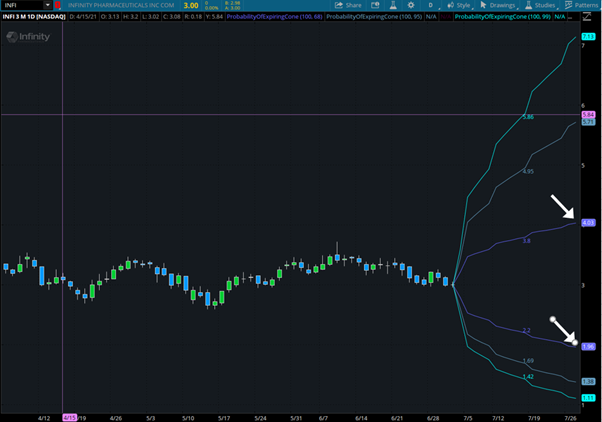
Then, after setting the 3 cones to 68%, 95% and 99.7%, the end result looks like what’s shown on the next chart.
Figure 3
Remember, placing cones out to 3 standard deviations on the chart typically isn’t necessary, as such moves are extremely rare.
Therefore, in the beginning it’s probably best to just stick with 1 to 2 standard deviation cones until you become more comfortable with the concept.
How do traders use probability ranges to construct options trades?
I’ve applied this study to the chart of Infinity Pharmaceuticals (INFI), which is one of the names we are tracking ahead of the stock’s upcoming catalyst (the expected release of Phase 2 data on July 27th).
Let’s say, hypothetically, you feel that the stock’s price will remain within a range leading into this upcoming catalyst, which is now a little more than 3 weeks away.
Well, earlier in the discussion it was revealed that most of the price action tends to happen inside of a 68% probability range, and that it is relatively rare for price to move outside of that range.
While there are times when price moves outside of the 68% band, such occasions are usually reserved for when price is reacting to an important news item or surprising earnings data.
When volatility is subdued and no anomalous news or data are being reported, however, traders can operate under the assumption that the 68% cone should be expected to contain most of the price swings.
Now that the trader has used this tool to establish the statistical likelihood price will remain within a certain range, he or she can express their neutral view by employing a market neutral strategy such as an iron condor, where a vertical call spread is sold to mark the top of the expected range and a vertical put spread to sold mark the bottom of the expected range.
Therefore, in this example the trader could use the $4.03 and $1.96 price points (see white arrows on chart directly above) that these volatility-based probability cones are suggesting will capture 1 standard deviation of price action by the 07/27 Phase 2 release date as the guidepost for anchoring the trade.
Bottom Line
Computers think in terms of probability, and humans should too.
Trading is becoming increasingly automated, with computers generating much of the volatility in recent years. Rather than being intimidated by this, humans should try to think more like computers, and using volatility-based studies like this is an ideal place to start.


12 Comments
Stunning story there. What happened after? Thanks!
Sounds very logical & meaningful !!!!
Hello, just wanted to tell you, I enjoyed this post.
It was helpful. Keep on posting!
Greetings from Florida! I’m bored to tears at work so I decided to check out your site on my iphone during
lunch break. I love the info you present here and
can’t wait to take a look when I get home. I’m amazed at how quick your blog loaded on my cell phone ..
I’m not even using WIFI, just 3G .. Anyways, very good blog!
I read this article fully concerning the resemblance of hottest and earlier technologies, it’s amazing article.
It is in reality a great and useful piece of info.
I am glad that you simply shared this useful information with us.
Please keep us informed like this. Thank you for sharing.
I believe that is one of the such a lot significant information for me. And i am happy studying your article. But should remark on few normal things, The website style is wonderful, the articles is truly great : D. Good process, cheers
I’m not sure where you are getting your info, but good topic. I needs to spend some time learning more or understanding more. Thanks for excellent info I was looking for this info for my mission.
An interesting discussion is worth comment. I think that you should write more on this topic, it might not be a taboo subject but generally people are not enough to speak on such topics. To the next. Cheers
This really answered my problem, thank you!
I have learn several good stuff here. Certainly price bookmarking for revisiting. I surprise how much effort you place to create this type of fantastic informative website.
Hey there! Do you use Twitter? I’d like to follow you if that wouldbe okay. I’m undoubtedly enjoying your blog and look forward to new posts.