The internet has put an enormous amount of information at our fingertips.
If you’re the type of trader who’s not afraid to explore unconventional sources of inspiration for new trading ideas, then you’re going to find today’s discussion very insightful.
The variety of available stocks and ETFs that can be traded these days is staggering.
When it comes to long-term finding trading ideas where price action is heavily influenced by pure supply and demand forces, the commodities market is where it’s at.
I’m about to show you how to use an assortment of free online resources to formulate a thesis for one of this planet’s most important commodities, which may be setting up for a new leg up in price due to drought-influenced supply disruptions.
The best long-term trades usually feed on fundamental narratives
The world’s most successful investor, Warren Buffet, famously speaks of only investing in fundamental stories that he understands.
Let’s face it, when most traders implement day or swing trade strategies, they’re not executing these trades for any fundamental reasons.
Instead, they are simply looking to profit from technically-inspired short or near-term market cycles.
When it comes to long-term trades, however, catching the tailwind of a supportive fundamental narrative is often a requirement for a long-term trend to develop in your favor.
Weather patterns warn of supply disruptions for key commodities like corn
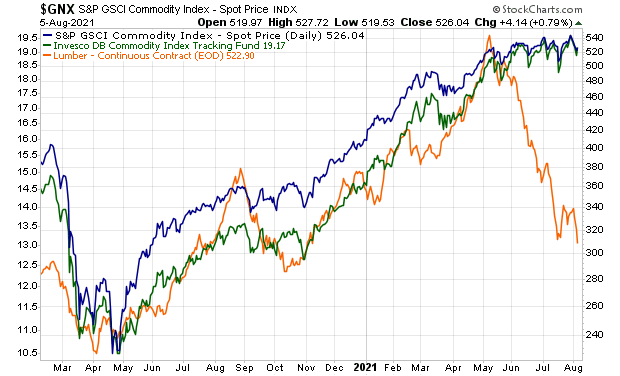
As the epic post-COVID crisis increase in money supply has made its way through the economy, inflationary forces have been on the rise, thereby causing prices in both hard and soft commodities to surge from multi-year lows.
Perhaps the most publicized example is the rise in lumber prices that occurred in Random Length Lumber Futures, where prices rose an astonishing 550% from the April 2020 lows to the May 2021 highs.
While lumber is one of the few commodities where prices have actually cratered since this year’s highs (lumber futures are down nearly 70% since the May 7th high close), prices of most other commodities that make their way into products that directly affect consumers’ wallets have actually been digesting their 2020 to 2021 gains in quiet consolidation ranges.
See Figure 1 below for more details.
Figure 1
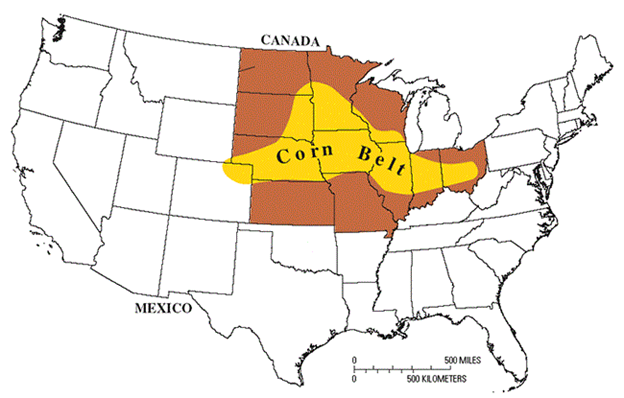
Today, we’re going to focus on one of the most critical commodities in the world’s food supply, corn.
As Figure 2 below shows, the Corn Belt in the United States spans across much of the north central part of the country.
Figure 2
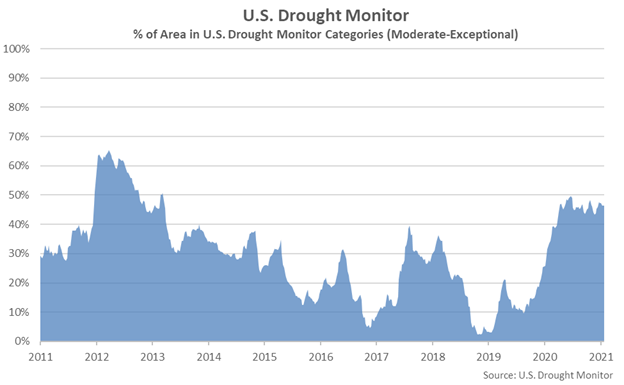
As Figures 3 and 4 show, however, this is a problem, since the US Drought Monitor, provided for free at https://droughtmonitor.unl.edu/, shows that nearly 50% of this territory to be under moderate to exceptional drought conditions.
Figure 3
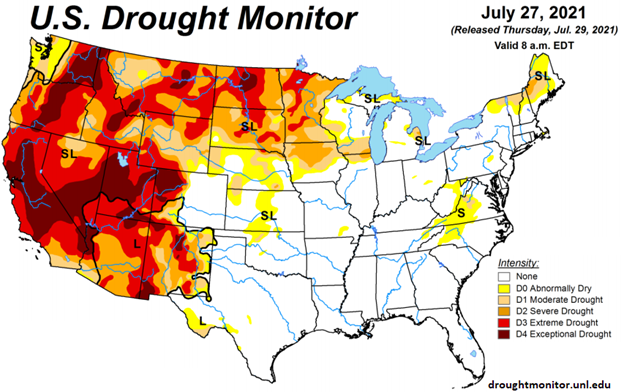
Figure 4
As this next chart from the USDA reveals, the level of corn-producing territory located in a drought state remains at a 9-year high, well above the 5-year average level of just 10%.
Figure 5
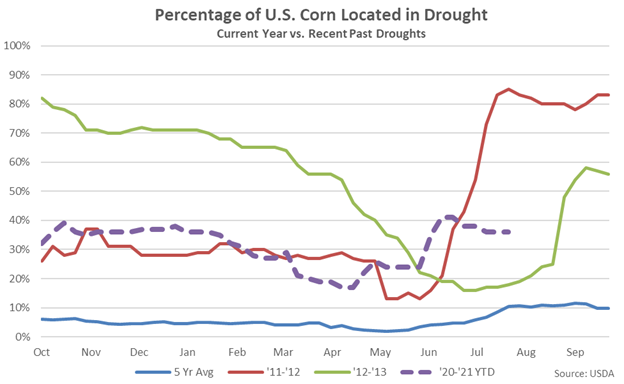
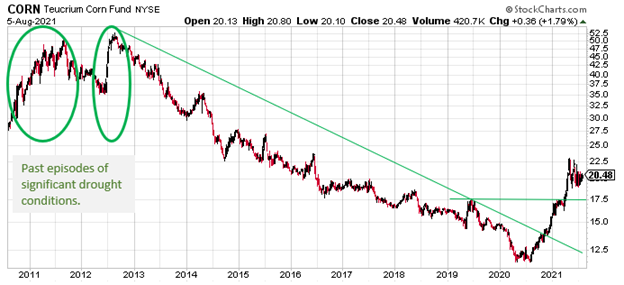
The other item to pay attention to on this chart is the comparison to the 2011 – 2012 and 2012 – 2013 periods, which were the last periods of significant drought conditions.
That’s important because, as the weekly chart of the Teucrium Corn Fund on Figure 6 below reveals, these were the last windows of time when corn prices were being driven sharply higher.
Figure 6
With the most significant drought conditions since then now developing, the diminished supply caused by these conditions is combining with the increased demand caused by the Fed’s efforts to boost the money supply.
The result is a newly developing long-term cycle of higher corn prices, which seems to be in the midst of a healthy pause ahead of the next leg higher.
Although drought conditions in the Southwest portion of the corn belt have improved significantly in recent months, much of the northern region of the corn belt remains in a drought during the most crucial time of the year for corn development.
Specifically, pollination may become an issue.
If that turns out to be the case, harvests could suffer across the corn belt, leaving the upward price pressures of late firmly in place, with the potential to increase.
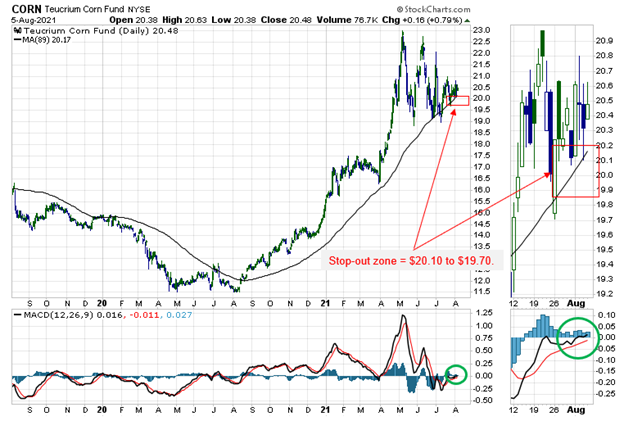
How can long-term trade corn’s uptrend?
Other than trading corn futures, which usually require special permission in retail trading accounts, the Teucrium Corn Fund (CORN) is an ETF that can be traded on its own or via options.
Technically, as Figure 7 blow reveals, CORN is currently being smoothed higher by its 89-day moving average, with what seems to be an imminent buy signal from the MACD momentum indicator.
Why the 89-day moving average?
First of all, it’s a part of the Fibonacci sequence, and in the commodities market price action is hugely influenced by these numbers.
Secondly, you’ll notice that CORN responds very well to this moving average.
Make no mistake; this does not guarantee that price will continue to use this moving average as support.
But, it does tell us that if this moving average’s supportive characteristics happened to break down in the coming days it would be an important signal that a more complex consolidation pattern still needs to develop before the longer-term uptrend up from the 2020 lows resumes.
Figure 7