One of my favorite things about social media is the abundance of content available on the topic of useful life hacks.
No, I’m not talking about the illegal act of accessing someone’s personal information or intentionally crashing a corporation’s web-based infrastructure via unsecured networks.
I’m talking about alternative ways of using easily accessible household resources to replicate some of the things that we find enjoyable in life.
You know, like how to recreate KFC’s yummy coleslaw, or how to turn an old 2-liter soda bottle into a hanging flower pot.
Essentially, the process that’s at work in many life hacks is the process of reverse engineering.
Well, what if I told you that a reverse engineered version of one of the most popular charting indicators is often available on many popular trading and charting platforms, allowing you to estimate the price at which a stock will be when that indicator reaches an important threshold?
I’m about to reveal this indicator to you and show you some real-time examples of how it can help you set entry and exit points in the current market environment. In addition, I’m going to give you a trading idea that still has enough momentum potential to keep moving higher for a short-term swing trade.
Behold the Reverse Engineered RSI Indicator
On its own, the relative strength index (RSI) momentum indicator is an effective and trusted method of identifying when securities are overbought or oversold, and whether a trend has supportive momentum characteristics.
Traditionally, traders need to wait for the price to get to a certain level before learning if the stock has reached levels that would traditionally be used to make trading decisions based on overbought or oversold conditions.
When we use the reverse engineered version, however, rather than reacting to the indicator, traders can anticipate the price at which key indicator signals will be triggered.
Here’s what I mean.
On Figure 1 you see the daily stock chart of Lattice Semiconductor Corporation (LSCC) with the traditional RSI indicator in the top panel.
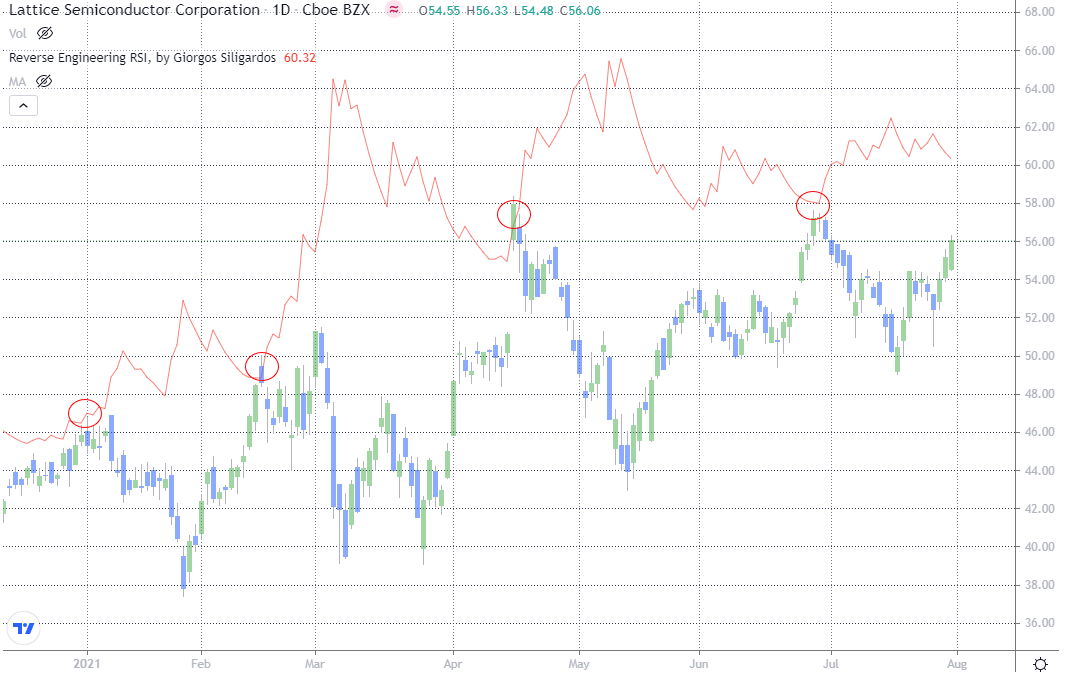
Below that, on Figure 2, you’ll see the same price chart with the reverse engineered version overlaid on the main price chart.
Both charts show the same window of time.
Figure 1
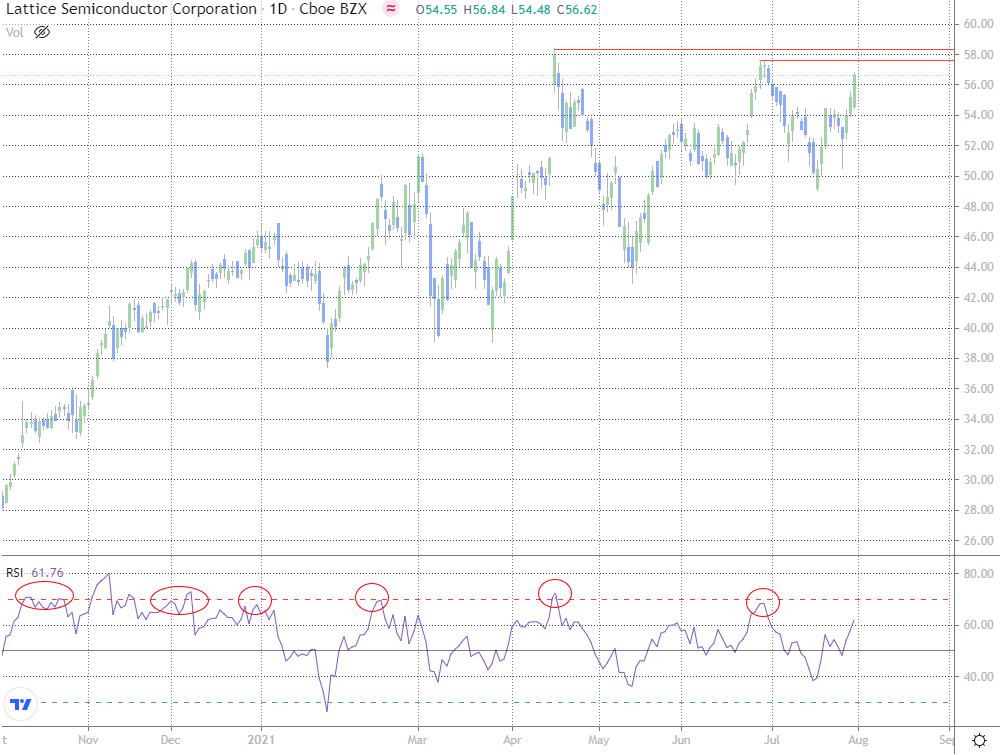
Figure 2
On Figure 1, notice that as the stock price is trending higher, the RSI momentum indicator is confirming the move with a recent break to new cycle highs.
With the RSI indicator now in a bullish regime above the 50 level, this week’s RSI upside breakout offers potential for additional follow-through, to the next important gap that sits 60 and 70.
Now, let’s say, hypothetically the stock continues to rip higher from here and you want to take some profits when RSI reaches textbook overbought status at 70, due to the fact that the stock has a history of developing tactical tops when RSI reaches this important threshold (see red circles).
By using this method, you have no idea what price needs to be reached for the RSI to finally register a 70 reading.
Therefore, there’s no way to set that exit price in your trading system ahead of time.
Enter the Reverse Engineered RSI indicator
On Figure 2, you’ll notice that the reverse engineered version of this popular indicator solves this problem by telling us at what price RSI would hit 70 during the current trading session.
Therefore, it’s key to understand that if you were to use this indicator as a method of setting a predetermined area to either take some profits on current longs or set a new short position, you would have to change the limit order level reading in your trading system on a daily basis to reflect this indicator’s updated.
There’s a couple of important things to note before we continue.
First, if you try this indicator remember you must adjust the indicator settings to the parameters you want. For instance, just like the legacy version of RSI, if you want to use the default 14-day lookback period with limits of 70 and 30, you have to set the reverse version to use these parameters.
Second, as I noted above, the level that you see on the chart is the level at which price would have to reach during the current trading session for RSI to hit the threshold you’ve set.
Obviously, the benefits of this are profound. Specifically, you have quantifiable evidence of the precise price level at which a stock will preset overbought or oversold parameters, allowing you to place high confidence entry or exit orders ahead of time.
Remember, just because a stock registers an overbought or an oversold reading does not mean that the trend is about to reverse.
As we’ve discussed many times before, reaching overbought and oversold levels is simply an indication that taking some profits on profitable trades is warranted, and that we as traders need to be on the lookout for signs that a top or bottom might be developing.
How can you find and adjust this indicator on certain platforms?
On Trading view, follow these steps:
- Go to the indicators tab at the top left corner of the chart.
- Type “reverse engineering RSI, then select it from the dropdown menu.
- Once it’s on your chart, to change the settings, hover over the text for that indicator that is on the chart and click the gear icon. In there you’ll be able to change the lookback period and thresholds to your desired levels. Remember, the most common setting for RSI is 14-days, with limits of 70 and 30. As you learn to trade, you’ll learn that there will be situations when you’ll want to change these settings. But that’s a discussion for another time.
In Think or Swim, follow these steps:
- Find the “Studies” tab (look for the picture of a laboratory beaker at the top of a chart).
- Click Add Studies, then All Studies > move your mouse down the alphabetical list to the R – R menu on the main pulldown menu and select ReverseEngineeringRSI.
- Once you’ve brought that indicator onto your chart, simply right click on the indicator and select Edit to change the parameters, if needed.
Look, there is no holy grail in trading. There are, however, indicators that can help us steer the course and stay out of trouble, and the Reverse Engineered RSI is one of them.
As a result of LCSS’s late week rally that pushed the legacy RSI indicator above 60, the textbooks tell us that the odds are now favorable that momentum will continue forward to the 70 level.