
Yesterday was a day for the books!
The action across many in-play penny stocks was incredibly volatile and presented so many opportunities.
As always, the key to taking advantage of the volatility and opportunity was being armed with a clear plan and waiting for confirmation before pouncing.
One stock, in particular, presented a unique opportunity yesterday. However, after breaking out, the stock reversed and might have topped out.
So let’s take a closer look at this stock and identify critical levels of support and resistance to try and determine whether or not the move might be over.
Biomerica (BMRA)
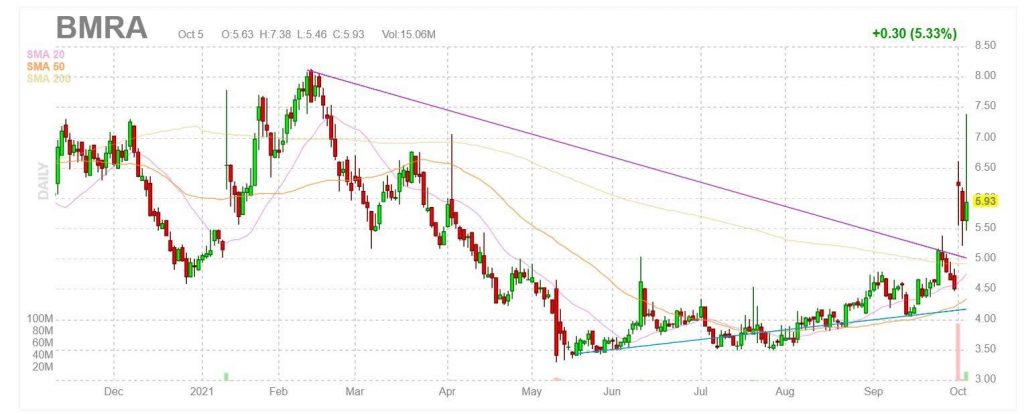
BMRA is a biomedical technology company. According to Yahoo, the company develops, patents, manufactures and markets diagnostic and therapeutic products for the detection and/or treatment of medical conditions and diseases worldwide.
The company’s diagnostic test kits are used to analyze blood, urine, or fecal specimens from patients in the diagnosis of various diseases and other medical complications.
Year to date, the stock is up 19.08% and 25.64% on the month.
Market Cap: 53.79M
Float: 10.51M
Short Interest: 9.27%
ATR: 0.59
Average Volume: 1.66M
BMRA rose sharply last Friday, as the company announced that Walmart is now selling its EZ Detect colorectal disease screening test.
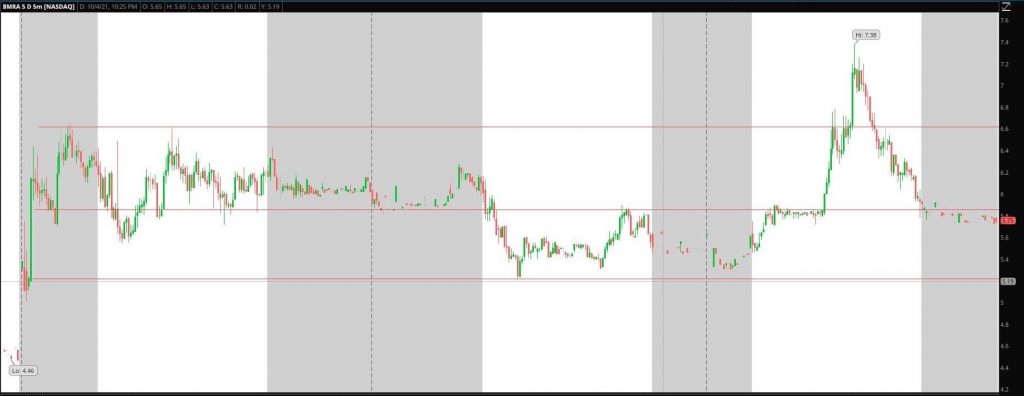
On day one of the move, the stock firmly established levels of support and resistance. Support from day one, in the pre-market, was found at $5.20.
Critical support intraday was established at 5.85.
Resistance firmly stood at $6.60 on day one.
On day two, the stock broke below the first critical level of support which stood at $5.85. Later in the day, the stock attempted to bounce and failed at that level of support. Therefore, on day two, critical support of $5.85 had turned into resistance.
Pre-market support from day one acted as support on day two. $5.20 held firmly and remained vital support.
On day three, the stock spent time consolidating right at critical resistance. After consolidating at $5.85, the stock broke out and traded to the next crucial level of $6.60 before breaking out further.
After making a new high on the day, the stock reversed and wiped out most of the gains on the day.
Key Takeaways from this chart
Identifying critical support and resistance levels is crucial and, in some cases, might be enough to formulate a trading plan in its simplest form.
By identifying the critical levels of resistance and support from days one and two, a trader might have been able to just react to the price action on day three.
For example, when the stock broke through resistance at $5.85 on day three, a reactive trade opportunity presented itself. A trader might have gone long through this breakout, with a profit target at the resistance level from day one.
Critical levels from days one and two on this chart acted as key inflection points on day three.
What’s next for the stock?
The close in the stock yesterday is certainly not what the bulls wanted to see. A reversal after a significant breakout might signal that the stock has topped out in the short term.
Since reversing yesterday, the stock is back in the middle of the range, and therefore support at $5.20 might be the final line in the sand for the bulls. If the stock breaks below $5.20, then a reversal might be confirmed.
Alternatively, if the stock can reclaim $6 and spend time basing higher, confidence might be restored in the long thesis.