Understanding the concept of relative strength and weakness can be a powerful tool. Not only might this be used to help manage trades, but the technique can also be helpful to identify potential trade opportunities and trends in a sector or specific stock.
I want to go over this topic in detail because this tool can be used in all market environments. It is not a tool conducive to one type of market or environment but rather to all conditions. I would go as far as to call it a timeless technique!
Relative strength and weakness refer to how strong or weak a particular instrument is versus another instrument. If the instrument you are mainly looking at is stronger than what you are comparing it with, you would say it has relative strength. Alternatively, if it is weaker than the comparison, the instrument is relatively weak.
This is an easy exercise to conduct, and most charting software offer it. For example, on Thinkorswim, it can be found by right-clicking on the screen, select: quick study, and then select: compare with. Simple!
Let’s look at an example by looking at the top-performing S&P 500 stock compared to the SPY ETF.
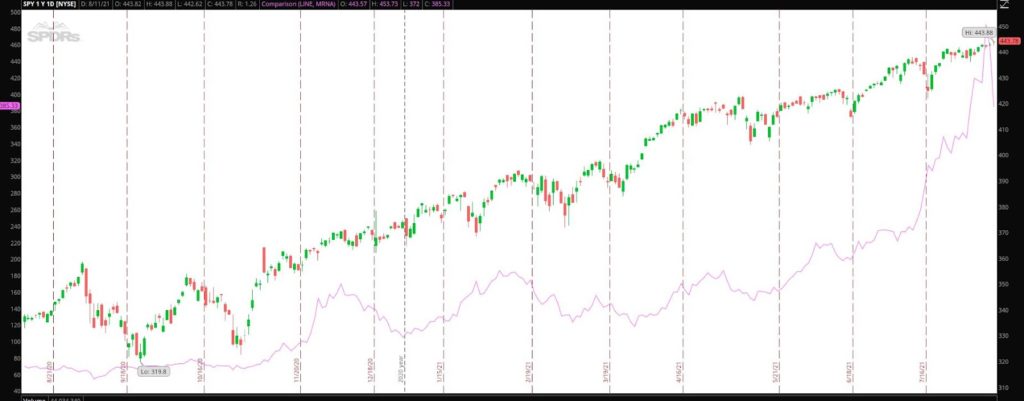
Moderna (NASD: MRNA) is the top-performing S&P 500 stock this year. Year to date, the stock is up 268.84%, while the SPY ETF is up 18.70%.
MRNA is represented with the purple line and left Y-axis, and SPY is the right Y-axis. I can see from the comparison that MRNA has dramatically outperformed the overall mark by looking at the extent of the stock’s up move. The low in SPY above is $319.80, while the low in MRNA is $54.21.
During one year, $MRNA increased 548.69%, while the market increased 33.35%.
Let’s look at another example. This time I want to look at a stock showing relative weakness. Let’s pretend that I wanted to buy a stock showing relative strength in the biotech sector. I have narrowed my list down to two individual stocks. Now I want to compare both stocks with each other and the IBB biotech ETF. I do this to identify which stock is showing the most relative strength or weakness.
First, I will compare both names with each other.
AMGN versus GILD
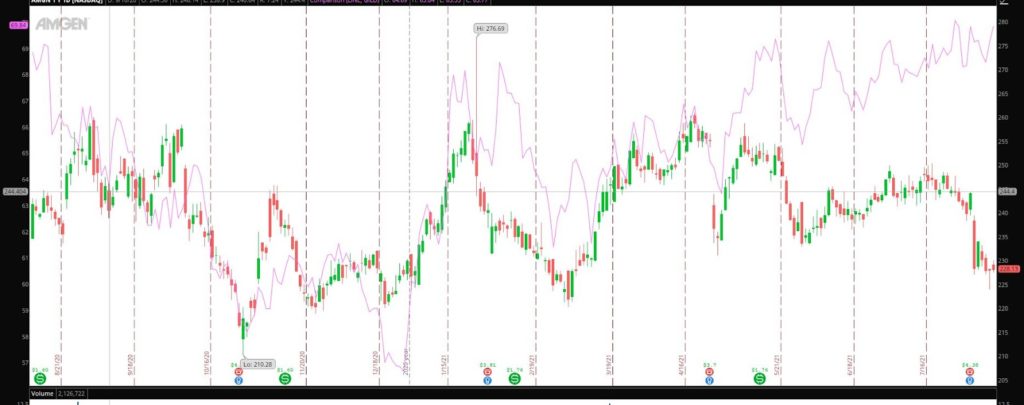
In the above chart, I can see that over a year, GILD, which is the purple line and left Y-axis, has outperformed shares of AMGN. In this case, GILD is showing relative strength to AMGN. AMGN is clearly showing relative weakness.
How do they each stack up against the sector ETF IBB?
GILD versus IBB
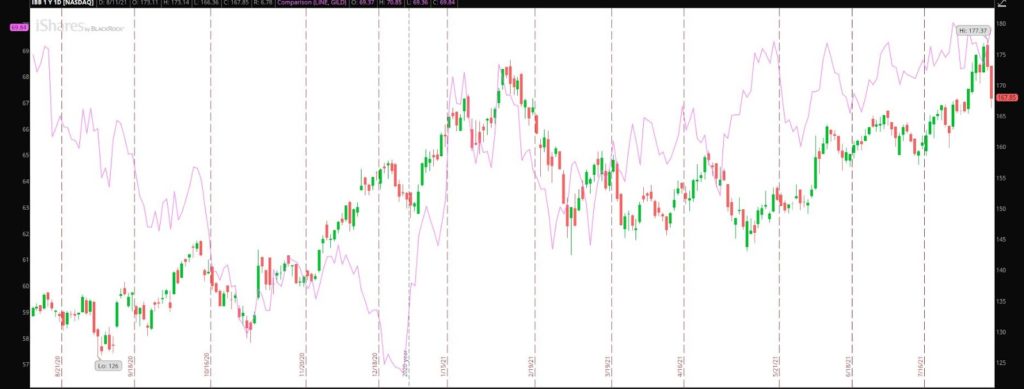
This chart tells me that GILD has outperformed the biotech sector year to date. On the recent pullback, shares of GILD impressively held up, which is a further sign of current relative strength. Year-to-date shares of GILD are up 19.88%, while shares of IBB are up 10.80%.
AMGN versus IBB
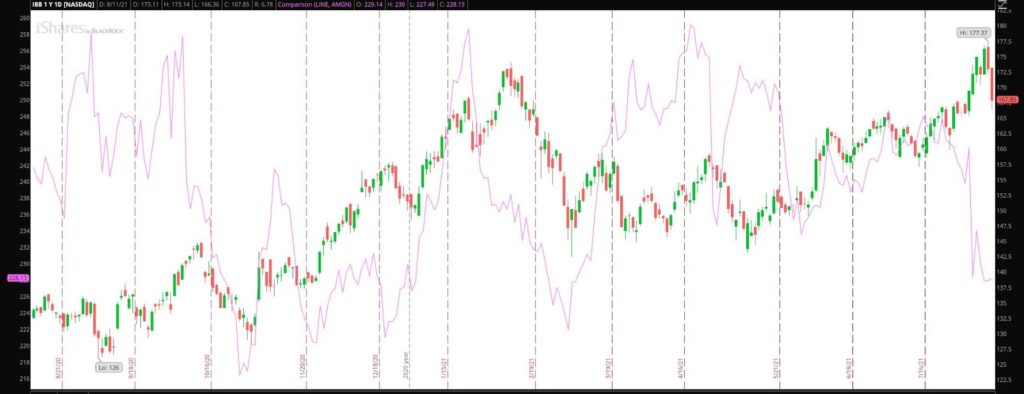
By comparing AMGN with IBB, I can see that not only is AMGN relatively weak versus GILD, but it is also relatively weak versus the biotech sector ETF. AMGN year to date is down 0.78%, while the IBB is up 10.80%.
For this hypothetical case study, these comparisons with the two stocks and the overall sector have helped me identify which stock is a stronger candidate for a potential long.
Although this is a simple technique, it should not be underestimated. This technique could also be used on days the market has a significant selloff. For example, on said days, this tool can be used to identify oversold stocks relative to the market, which could present a buying opportunity.
The technique could also be used to identify stocks that are showing great strength versus the market. That could also present a buying opportunity.
This technique could also be used to identify which industries show strength or weakness when the overall market has significant up or down days. When the market experiences corrections, this technique can identify sectors that offer relative strength and safer options to be long, for example.