
Forget about the headlines for a second.
Stocks move based on supply and demand.
While headlines may cause shifts in the supply and demand, it all boils down to buyers and sellers duking it out, and there’s one specific indicator I love for this.
Volume.
It’s standard on most charts, yet many don’t even pay attention to it…and it’s packed with helpful information.
I will walk you through how I use volume to unlock valuable insights into supply and demand…regardless of trying to make sense of the headlines.
The Significance of Volume
Analyzing volume can help you determine the strength or weakness of a price move.
When a stock is moving up or down in price, the strength of the move can be determined by the volume for that period. This is because traders put more significance on stock moves with higher volume attached…
But why do traders place more significance on moves with volume?
High volume suggests a heightened interest in a stock. So when a stock chooses a direction on high volume, it is often viewed as a signal of strong momentum in that direction.
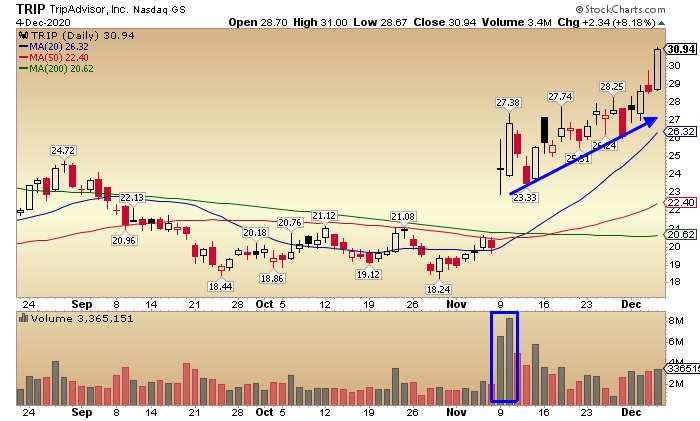
As you can see in the chart below… The increased volume in the stock (blue rectangle) is coupled with a price move up, in this case a gap up. The volume is confirming the significance of the move and trader confidence in the direction of price.
And with that, the stock made an extended move up (blue arrow)…
Causes of Volume Spikes
The volume of a stock is usually higher around news or other big events.
This is due to the new information being released.
Investors then have to factor this new information into their trading plans creating more transactions than usual as they adjust their portfolios.
Examples of high volume events:
- Earnings reports
- Product announcements
- Mergers and acquisitions
- News relevant to a company’s operations
- News that affects competitors or a whole industry
Traders can use this spike in volume to get in a good position, so it can be a good idea to keep an eye out for these types of events.
Using volume in trading
Stock volume is loaded with valuable insights into the movement of stocks. Unlocking this value, however, takes practice.
Being able to put volume into perspective is key… and for that, we have the stock’s average volume. This provides you with a reference point when deciding when a spike in volume is significant.
First, you want to compare the volume to recent time frames as the volume from years ago may not relate to the volume today. So your average daily volume will generally be a rolling average over a recent period… such as 20 or 30 days.
Using the average daily volume, you can get a better idea of the significance of real-time volume as you look to take trades.
If a stock has an average daily volume of 9.3 million and suddenly trades 61.2 million shares, that’s significant… time to open your eyes.
Visually you can see this by overlaying the average volume line in the volume window of your chart.
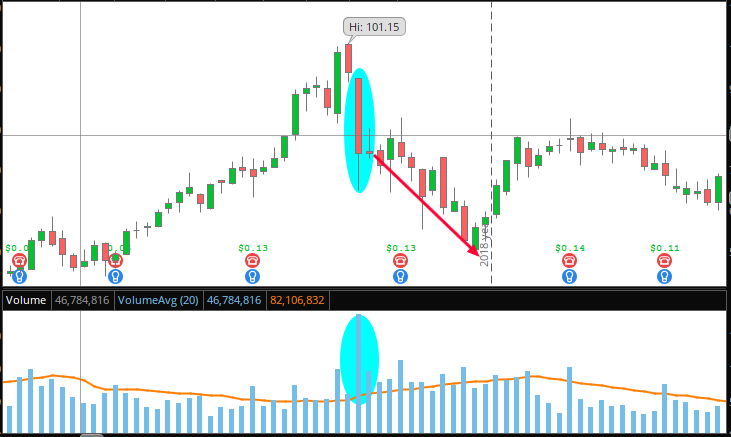
In the chart below, the blue bars in the bottom window represent the daily volume, and the orange line shows the average over 20 trading days.
So when the blue bars get above the orange line, the volume is above average.
I circled an instance where volume was way above the line, therefore showing a significant increase in volume for that day.
Comparing current volume to the average volume is the simplest way to find trading interest in a stock.
Here’s how I use it in my trading:
I’m simply paying attention to stocks that are moving on high volume relative to what’s normal for them.
You can overlay the average volume line, like above…or just look at the bars compared to each other…
You can see significant levels of volume just by looking at the chart because it will stick out.
Take a look at GMER…
This is an example of a consolidation breakout trade.
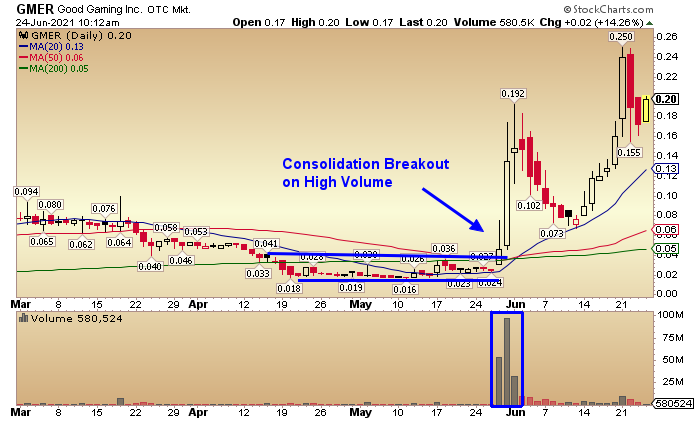
The stock consolidates for a couple months before volume/ demand comes in and pushes it up.
The blue rectangle shows what I would call a significant spike in volume.
And once paired with a few basic chart patterns such as the consolidation and stair step patterns, I’m able to put it all together to find my trades.
If you’ll notice…this isn’t a long term play.
This is a key part of my end of day momentum trading…using a spike in demand to get in and out before the stock price falls off.
These aren’t big name stocks that I would want to hold for years, so it’s important to keep that in perspective.
Now take a look at PSWW…
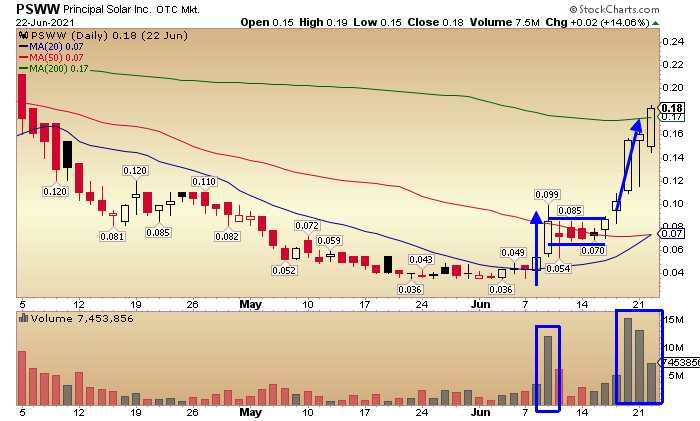
After the initial move up on a spike in volume, the stock consolidated in what can be seen as a flag pattern.
PSWW then broke above the range on a big surge in volume.
That’s key to the trade because it shows me the conviction behind the move.
The first move into a flag consolidation helped point the way for the eventual breakout.
It’s not over yet though. Here’s what happened next…
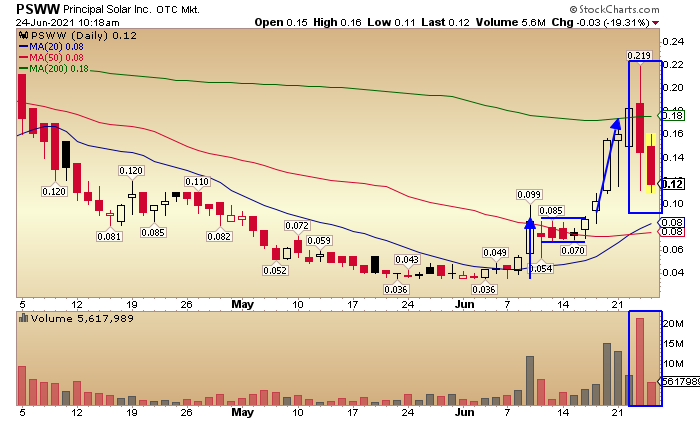
The stock hit resistance at the 200 day MA line and headed back down.
This is a prime example of why it’s important to have a reasonable price target and get out of the stock as it makes its move, as opposed to waiting for it to be over.
I don’t try to grab every last cent in a trade either. The last thing I want is to be holding the bag when the momentum swings back the other way.
This is about trading, not investing. So I’m not trying to find stocks to hold for long periods.
I am simply looking for short term momentum swings and for that reason VOLUME is a key indicator in all of my bread butter trade setups.
It’s that important.
Final Thoughts
Stock Volume packs in a lot of great information if you are able to understand it.
Letting volume bars sit on your charts while paying little to no attention to them is a rookie mistake. Successful traders place a great deal of value on volume and actively use it, so it’s wise to spend time learning about it.
In my opinion, Volume is one of the simplest and most valuable trading tools out there.


6 Comments
very good approach. Jeff
thank you for your information .
learned today. Thanks!
Thanks for the volume education. Very good information.
I love this one but not fully convinced may be because of my lack of knowledge
Really like what you do. As a small-time swing trader, I truly benefit from your approach and teaching methodologies.
Please keep up the great work!