Price charts don’t lie!
They are a snapshot of what a large pool of some very smart investors and traders feel a company should be valued at, based on all known information.
Those same price charts are also known to provide insight into where a company’s share price may be headed in the future.
They certainly don’t tell you whether that future price path is going to resemble a straight line or a series of fits and starts, but certain reliable price patterns do a good job of providing accurate price targets.
Not all patterns fulfill their measured potential, however, as there are countless market, economic, and geopolitical forces that can pop up out of nowhere to derail these moves.
As traders, we have to develop the ability to follow trends until they show signs of breaking down, then we must show the discipline to exit positions as soon as it is obvious that the trade is no longer working.
Right now, I’m watching an industry ETF that just broke above a beautiful multi-month consolidation pattern that now projects enough upside potential to produce sustainable gains over the near-term.
The Future of AI and Robotics
According to MarketsandMarkets,” the top robotics market is projected to grow from USD 76.6 billion in 2020 to USD 176.8 billion by 2025; it is expected to grow at a Compound Annual Growth Rate (CAGR) of 18.2% from 2020 to 2025.
Collaborative robots are becoming more affordable and easier to program for novice users, leading to growing demand for collaborative robots across all industry segments.Service robots are increasingly being adopted for new applications due to various advantages such as increased productivity, streamlined processes, and greater workplace safety. The main advantage of using service robots is the reduction in the cost of operation and high ROI. The objective of the report is to define, describe, and forecast the top robotics market based on type, component, environment, application, industry, and region.”
How can traders participate in this industry?
Nowadays, there’s usually an ETF that offers retail traders the ability to play in any corner of the market.
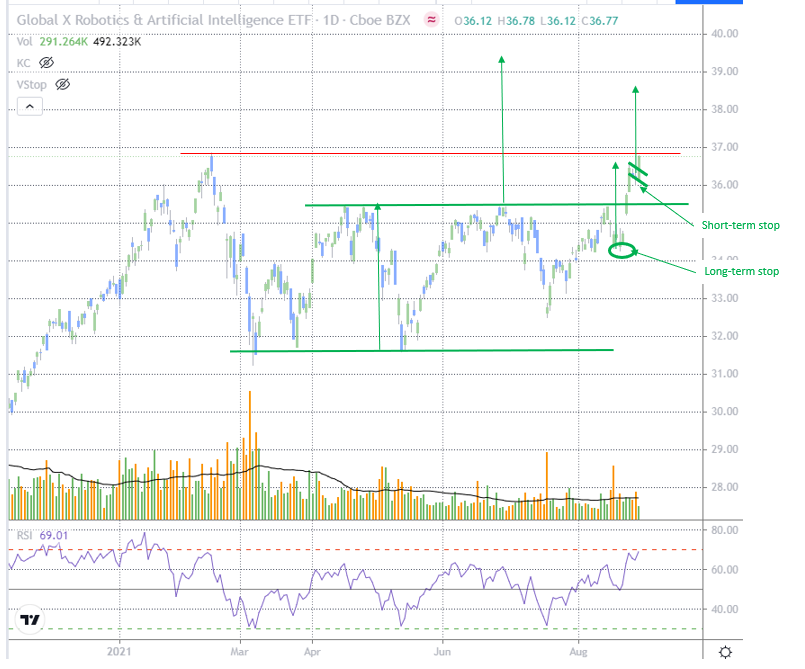
The ETF that caught my eye while scanning for recent breakouts is the Global X Robotics & Artificial Intelligence ETF (BOTZ).
Figure 1 below shows the recent breakout of a combination “double bottom,” “cup-and-handle” consolidation pattern.
As the chart also shows, the upside potential generated by this breakout extends to $39.15 over the days-to-weeks ahead.
Figure 1
How can traders approach this opportunity?
Since the large pattern breakout discussed above, BOTZ has been growing closer to a test of the February all-time highs.
If the plan is to chase the recent “flag” breakout with shorter-dated call options because Friday’s “flag” breakout suggests that the target of $38.62 (see chart) can be met in just the next few days, there should be very little retracement from here and stops should be placed at the bottom of the recent “flag” at $35.99.
If this approach is too aggressive, traders could prefer to trade the larger breakout potential to $39.15 with longer dated calls or perhaps a bullish vertical spread, then contingencies for a possible pullback to retest the recent breakout area of $35.40 must be built into your plan.
In other words, if your plan of attack here is to participate in the current uptrend from the 07/19 low, with your objective being the post-consolidation pattern target of $39.15 over the weeks ahead, then, by definition, the most recent pivot low of $34.25 cannot be violated, as this would negate the current bull trend.