Today I want to share a key indicator with you and explain how it helps me identify a potential breakout opportunity.
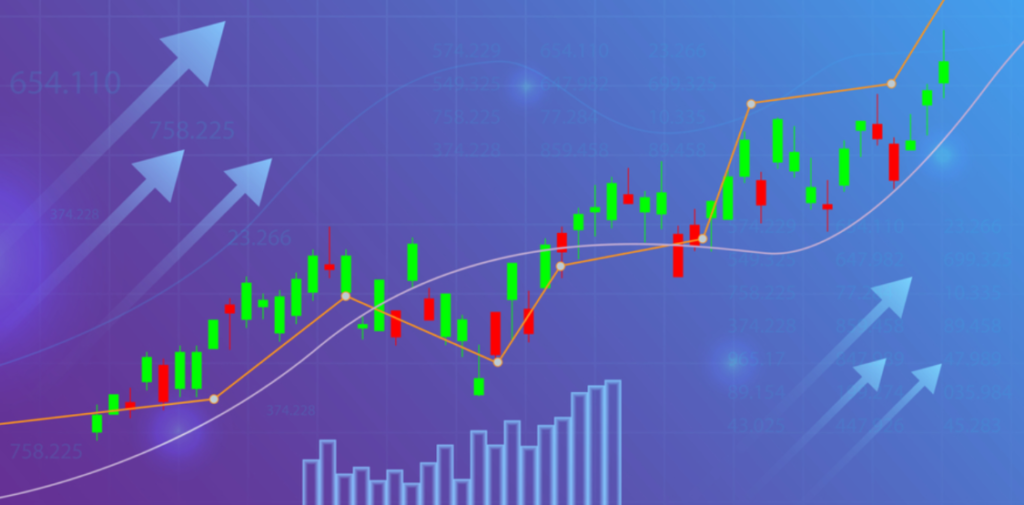
As you know, one of my favorite setups is the consolidation breakout pattern.
Well, this indicator will often help me identify a potential breakout pattern on a higher time frame.
This indicator on its own, or used with others, helps me identify potential trade opportunities and possible support and resistance levels.
I will also often use the 50-day MA as a potential stop-loss area or profit zone.
The indicator could also identify a reversal and shift in momentum.
First things first, let’s cover the basics.
What is the 50-day Moving Average?
A moving average is the mean of data points over a specific period. For example, the 50-day MA will use 50 data points, whereas the 200-day MA will use 200 data points.
The 50-day MA equals the average price per share that all investors have paid over ten trading weeks.
On Thursday, I spoke about two specific watch list game plans on the Biotech Breakout Mid-Day Watch List that included the 50-day MA as a condition.
I will revisit these two watch list ideas from Thursday to show you how and why the 50-day MA played a vital role in my plan.
Zomedica (ZOM)
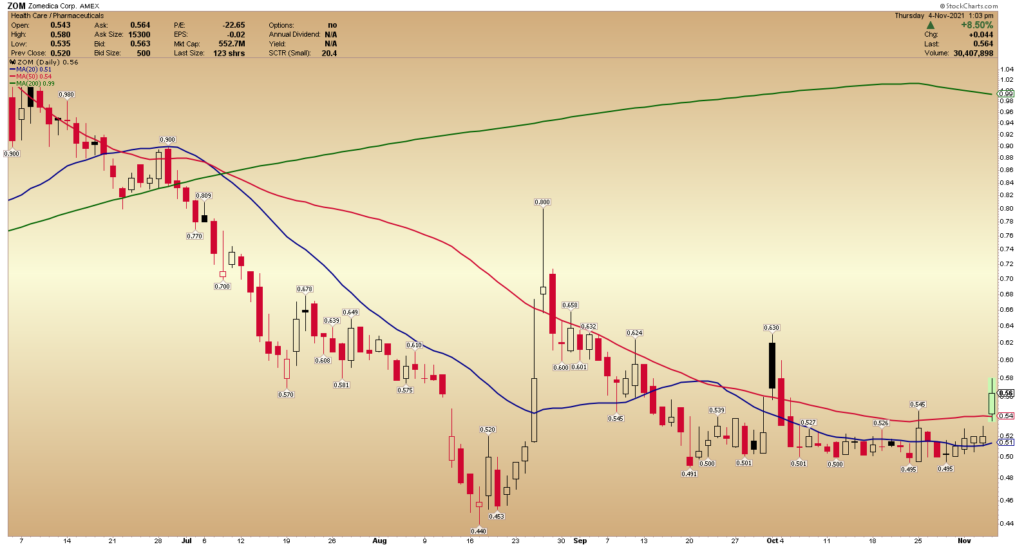
ZOM was included on my watchlist mid-day Thursday, as the stock finally traded above the 50-day MA.
My exact plan was:
“ZOM is finally breaking above the 50-day MA line here at $.54, and I would like to see this HOLD over $.54 if I am going to make a trade on this today. My trade plan is to look for entry near $.55 with a target sell of $.65 to $.70 on the swing with a stop loss around $.52 which is just above yesterday’s closing price.”
ZOM had based below the 50-day MA for several weeks and finally was able to break above and spend time above. This signaled a potential reversal and that a consolidation breakout pattern might be in the works.
In this case, the 50-day MA acted as critical support and the basis for the trade idea and inclusion on the watch list.
Iterum Therapeutics (ITRM)
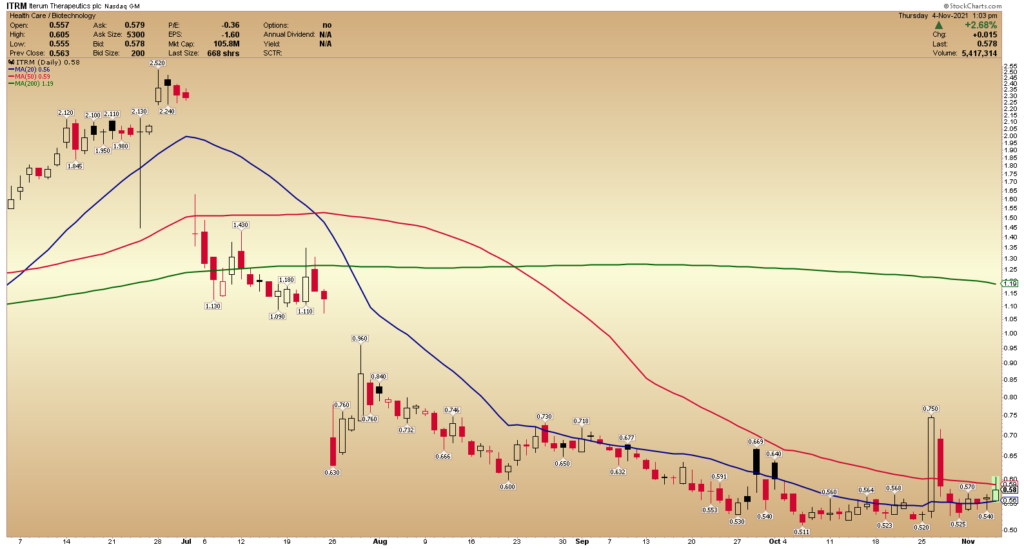
ITRM, another stock on the Mid-Day Biotech Breakouts Watch List, was included because the stock was trading near the 50-day MA and was potentially setting up for a breakout.
My exact plan, from the watchlist, was:
“ITRM in on my watch list here assuming it can hold $.60 level, which is right near the 50-day MA line, which would be my target entry price. I would look for a possible sell area of $.70 to $.75 and use the 20 day MA line at $.56 as a possible stop loss.”
At the time, ITRM had not yet broken above and held above the 50-day MA. Therefore, as with ZOM and watchlist ideas in general, this was a conditional plan.
It is a condition because I would only place a trade in the stock if it met my criteria. I needed to see the stock break above and hold above the 50-day MA before considering a long.