On the 4th of August, 2021, I wrote about the strength in the IBB and the bullish setup in GILD.
At the time, GILD was trading below $70, consolidating in a bullish pennant, and I wrote:
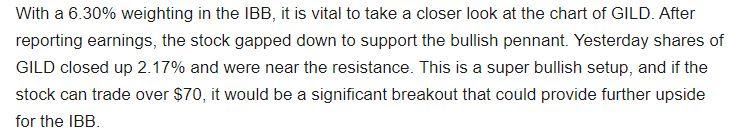
It appears I was right on the money as GILD proceeded to break out and achieve a high of $73.34.
The stock is now consolidating over previous resistance, which is a sign of strength. So could GILD be poised for further upside?
With a significant weighting in the IBB, it’s essential to look at the ETF and sector to identify potential relative strength or weakness.
The IBB
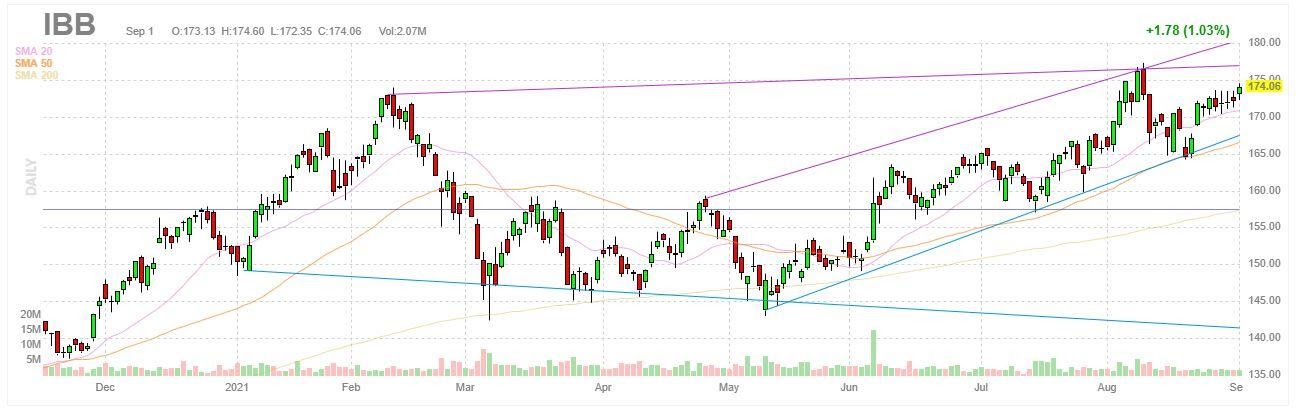
The biotech sector experienced a healthy pullback last month. The IBB traded right into significant support before bouncing. The uptrend held firmly, and bulls provided the support necessary to confirm a higher low and keep the bull thesis intact.
Yesterday, the IBB closed the day up 1.03%. The ETF is up 14.90% year to date and 30.85% over a year.
The IBB currently has a bullish chart pattern, as the stock continues to consolidate near the all-time high. $175 is critical resistance in the ETF. Therefore the bulls will want to see shares hold above $175. Over $175 and holding firmly, the all-time high of $177.37 will come into focus.
This strength in the biotech sector bodes well for GILD.
Comparing IBB to GILD
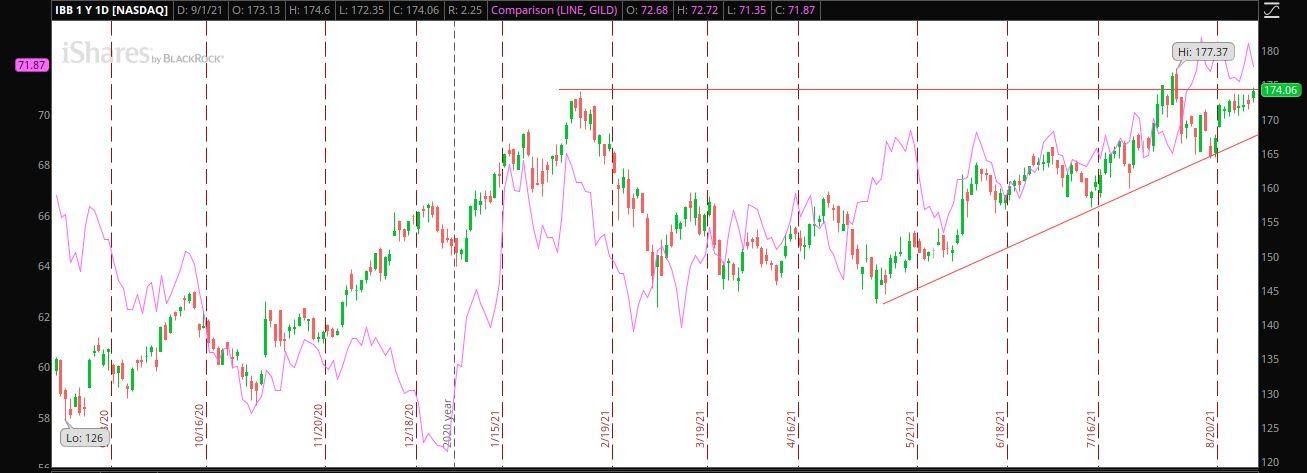
In the chart above, I have overlaid the IBB chart with GILD. GILD is represented with the pink line.
If you would like a re-cap on relative strength and weakness, check out this article I wrote last month explaining the concept.
From this comparison chart, I can see that GILD and IBB are correlated. This is no surprise as GILD holds a 6.42% weighting in the ETF, making it the third-largest.
In recent times, however, GILD has outperformed the ETF and shown relative strength.
This is a sign of strength for the stock and might give further confidence to the GILD bulls.
Gilead Sciences (NASD: GILD)
Per Yahoo, GILD, a research-based biopharmaceutical company, discovers, develops, and commercializes medicines in the areas of unmet medical need in the United States, Europe, and internationally.
Shares of GILD are up 8.11% on the quarter, 23.36% year to date, and 9.18% over a year.
The stock has an average target price set by analysts of $75.57, which is considerably higher than where the stock closed yesterday ($71.87).
Gild has an 81.60% institutional ownership and is a member of the S&P 500 Index.
Market Cap: 90.3B
ATR: 1.14
Float: 1.25B
Short Interest: 2.05%
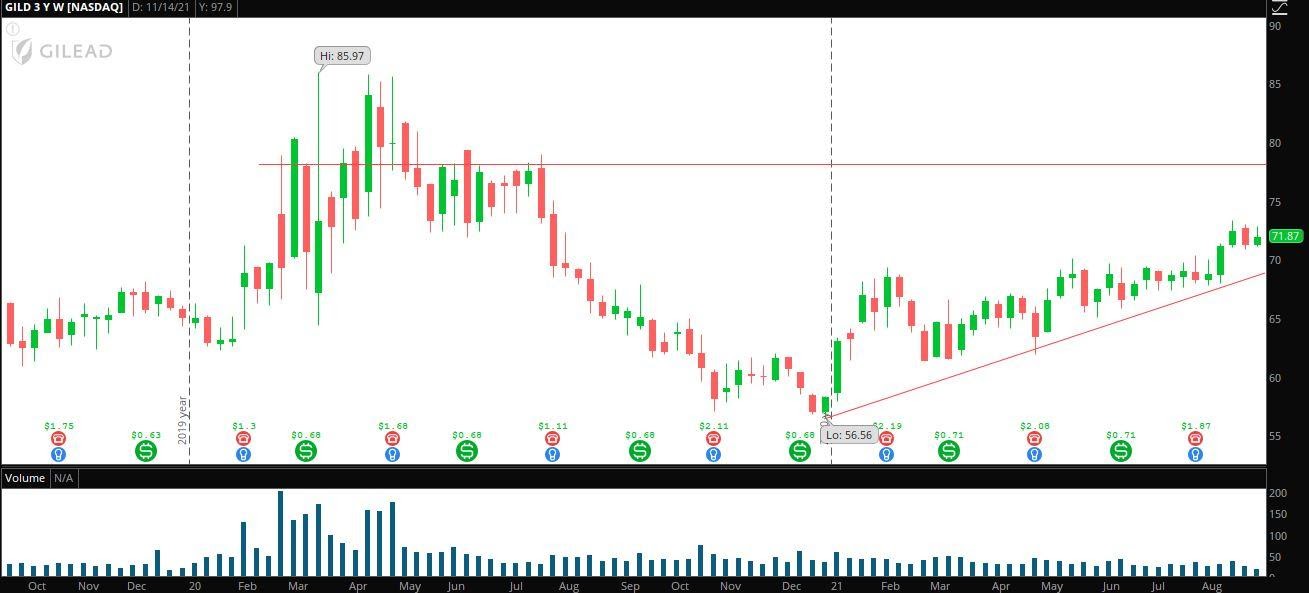
In the above three-year weekly chart of GILD, I can see that since bottoming out at the beginning of the year, shares of GILD have steadily maintained the bounce.
Currently, support of the uptrend is nearing $70. Significant resistance on the three-year weekly chart can be seen around $78 – $80, where the stock failed to hold above last year.
Therefore, the above levels will act as crucial support and resistance areas on a higher time frame.
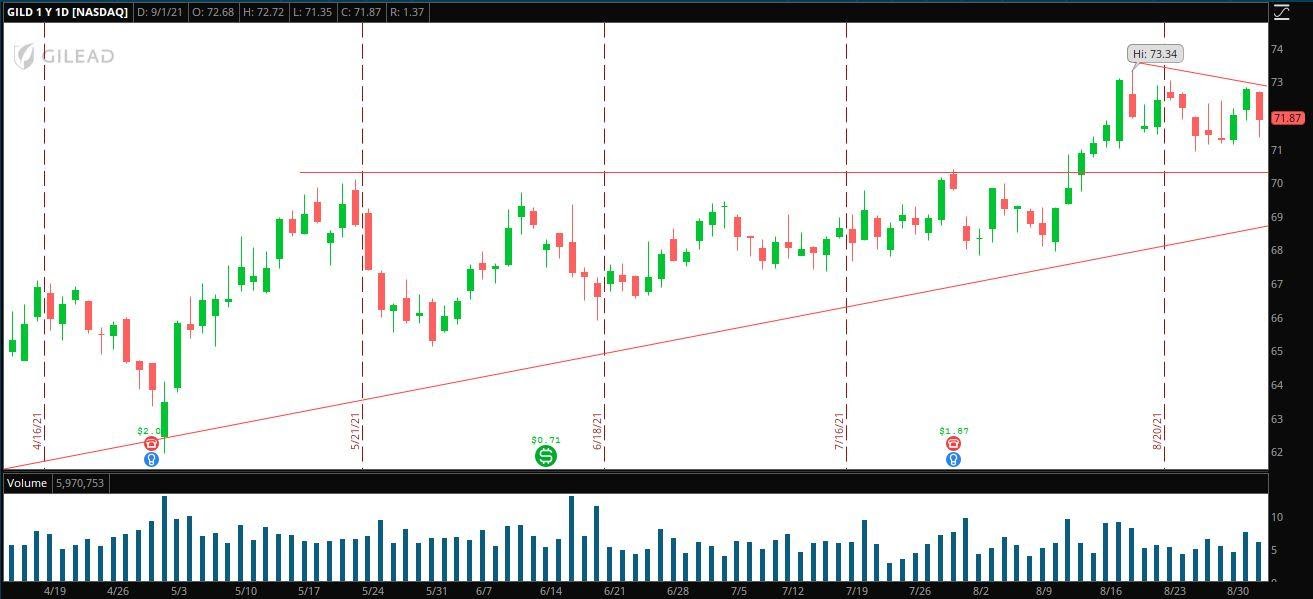
The above chart is the one-year daily. Since GILD was able to break out of the bullish pennant, shares have held firmly above prior resistance levels.
This is a sign of strength. Previous resistance of $70 has now turned into a key level of support in the short term.
The stock has spent over two weeks consolidating since breaking out, with $73 being resistance.
In the future, bulls might want to see the stock continue to hold above support and then advance over $73. If the stock can turn $73 resistance into support, then the levels from the three-year weekly chart will become the next levels of resistance.