

Today I want to go over a specific setup with you. A setup that forms over a day, a week, or multiple months and offers immense risk: reward.
To better understand this setup, I am going to go over two examples with you.
The Setup:
The Pennant Setup is a continuation pattern. Typically, this setup is formed after a stock has made a significant move upwards and then spends time consolidating. During this consolidation period, the range of the consolidation will narrow, and the trendlines will converge. A breakout follows the convergence in the same direction as the initial move.
Here is where many lose their way ──because they simply aren’t looking in the right direction. What follows this consolidation, the breakout can make or break a trade depending on your position.
The big question is how do you spot this move in the making?
Here is an example:
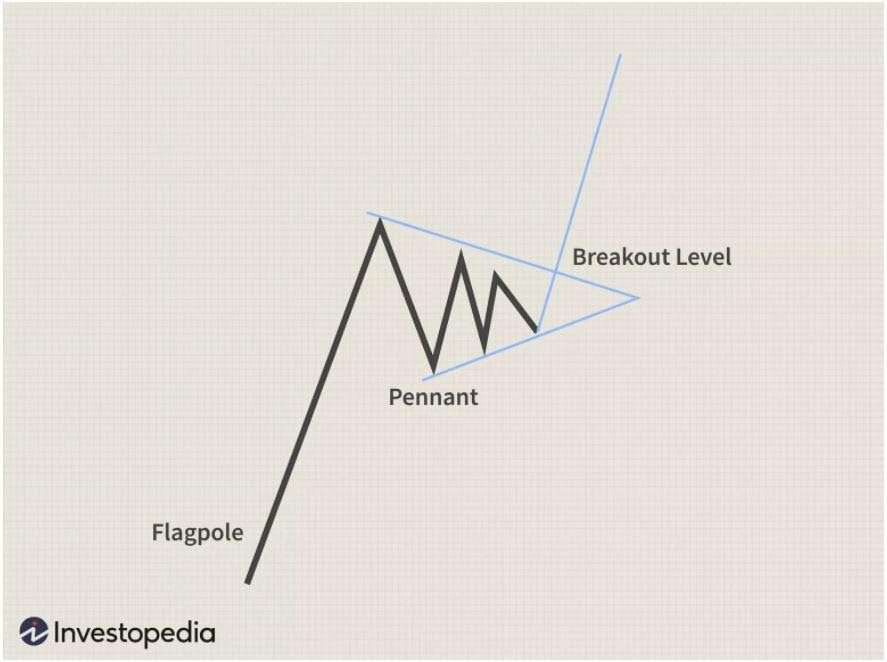
Image Source: Investopedia
There are many different ways a trader can trade this pattern. For example, many traders will buy the support of the pennant and look to add as the stock breaks out. Other traders who are short-biased on the stock will wait to see if it breaks down and then short it. Traders who short the stock will often assume it is long crowded, and if the stock breaks below support, there will be momentum to the downside.
Conversely, momentum traders on the long side will wait until the stock breaks out of the pennant and then buy shares in the hope of catching another leg higher.
Earlier in the week, I wrote about this exact setup that formed in XBIO.
My exact words from that post were:

Example of a Bullish Pennant in XBIO:
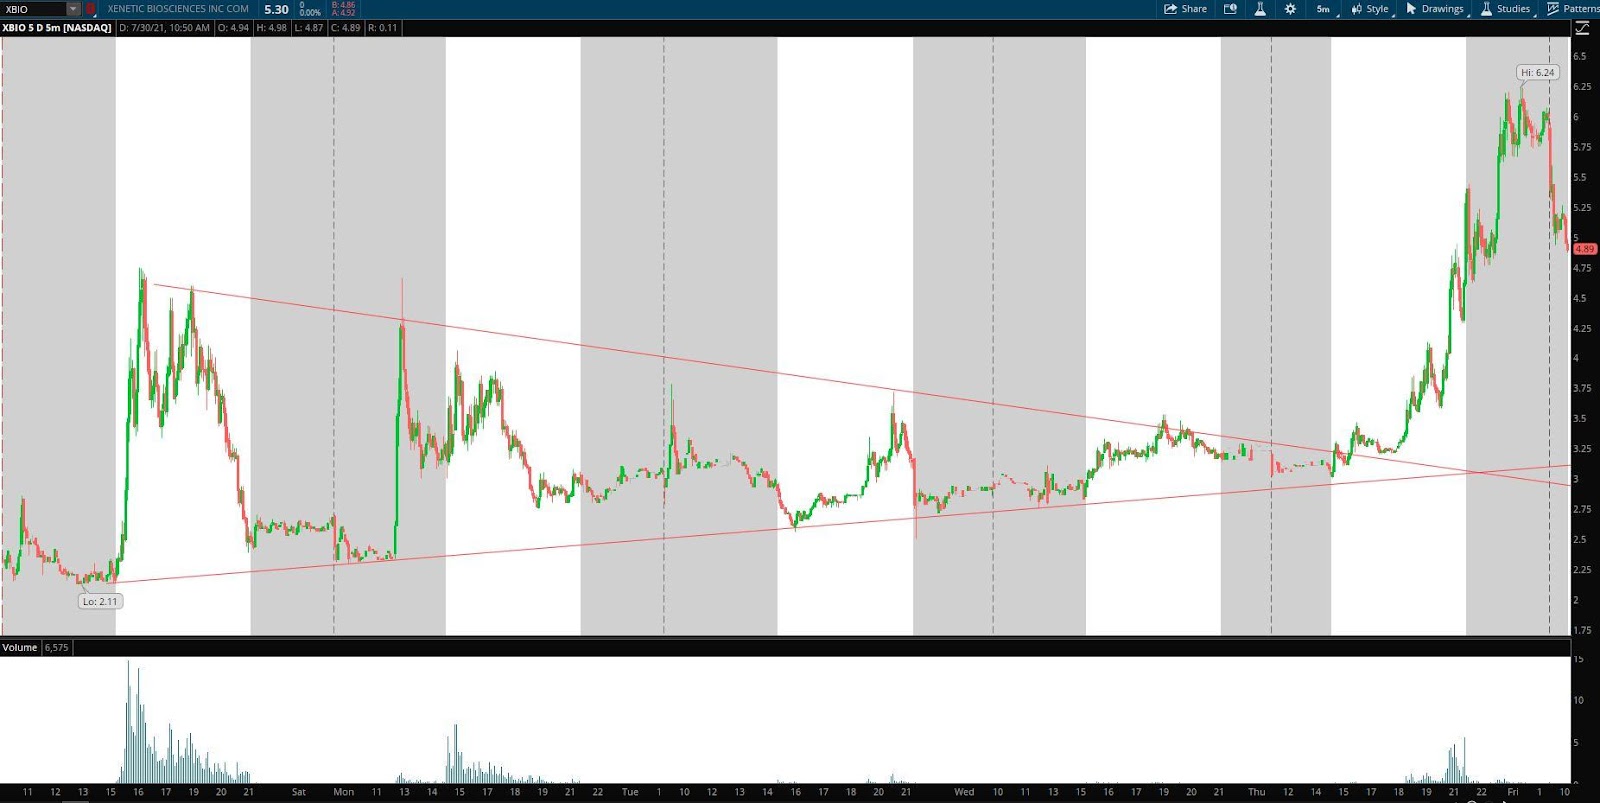
You can see that after the stock was based for a few days, digesting the initial leg higher; it began to hold in the UPPER part of the pennant. Just as I mentioned in the article, you wanted to see volume increase and a breakout over $3.60. This breakout had all the checkmarks, and therefore shares of XBIO exploded to $6.24 in the after hours.
When reviewing a setup, you should always ask yourself how you would have traded it? There are a few different options here:
- When the stock held above the resistance of the pennant at $3.30: That could have been bought with a stop placed below support which was $3 at the time.
- When the stock broke above $3.50 – $3.60: This confirmation move could have been bought with a stop at $3.20. The stop is placed there because you do not want to see the breakout move fail right after it occurs.
- The $3.62 pullback after breaking out: This is further confirmation because the stock broke out, pulled back and made a higher low, and then made a fresh leg higher to $5. The higher low tells you that buyers are firmly in control, and therefore the support could have been bought with a stop placed below $3.50.
This is an excellent example of the bullish pennant in action. We had an initial move higher, followed by a consolidation and convergence of the trendlines. After that, a significant increase in volume and break of the highs from the initial leg. Great chart to study and review.
Let’s take a look at another example from yesterday. This time on the short side.

Above is Tilray (NASD: TLRY) from yesterday. After a sharp selloff in the morning, the stock attempted to bounce back but failed and then consolidated. You should notice how, during the consolidation, shares of Tilray began consolidating near support of the pennant. Compare this with the above chart of XBIO, where shares were consolidating near resistance and then above resistance.
After failing to break out from the pennant on the long side and spending time at support, shares of Tilray broke lower. At the time of breaking lower resistance of the pennant was $16, and support was $15.90.
So how could this breakdown be traded?
- When the stock failed multiple times to hold near resistance, this price action could have warranted you to short the stock while still consolidating in the pennant, with a stop just above resistance. You could have added to the position once the stock broke below support.
- Once the stock broke below support of $15.90. Once the stock breaks below support, there is confirmation of a bearish breakdown. In this situation, I would hit the bid on the support break and place a stop at $16. The stop should be placed at $16 because I would not want to see the stock reverse and get above that price if this breakdown is going to have momentum.


2 Comments
Good thorough explanation
Understand Champ, thanx. But where can I see the live training record because I keep missing due to time differences. Please help so I can follow in morning to study.