

Unfortunately, Crime is a Narrative that Long-Term Investors Should Consider Investing in
When it comes to long-term investing, a fundamental narrative with enough staying power to feed long-lasting industry growth and bullish trend characteristics is essential to an investment’s success.
Unfortunately, the upward trajectory of crime in this country is one narrative that investors have been betting on in this new post-COVID world.
As investors, we have the freedom to choose whether we want to profit from trends that negatively affect society.
Today, I am going to discuss the technical setup of one company that specializes in “less-lethal” personal defense products, and whose stock is building one of my favorite patterns.
Crime is on the rise
The majority of this country’s largest police jurisdictions saw increases in at least one category of violent crimes in 2020, which include homicide, rape, robbery, and aggravated assault, according to a report produced by the Major Cities Chiefs Association.
Although the economy has recovered from the depths of the COVID crisis, the crime surge has continued into the first half of this year.
Thanks to a “perfect storm” of social anxiety because of a pandemic, de-policing in major cities after protests that called for the abolition of police departments, shifts in police resources from neighborhoods to downtown areas because of those protests, and the release of criminal defendants pretrial or before sentences were completed to reduce risk of COVID-19 spread in jails, a number of major cities have indicated they are still experiencing high rates of violent crime.
In Chicago, homicides were up 33% in the first three months of the year compared to 2020, while shootings are up nearly 40% for the same period year-over-year. In New York City, the NYPD data shows murders jumped by nearly 14% through March 28, the latest numbers the department has made public, while shootings were up nearly 50%.
Introducing Return On Capital Employed (ROCE)
The art of identifying a stock that can grow to become a multi-bagger over time is complex.
It starts by identifying certain key fundamental strengths, many of which may be quite foreign to a lot of retail investors.
Today, I’m going to introduce you to one of these fundamental measures called return on capital employed (ROCE).
What is Return On Capital Employed (ROCE)?
ROCE is a metric for evaluating how much pre-tax income (in percentage terms) a company earns on the capital invested in its business.
If applied to Byrna Technologies, the formula would look like this:
Return on Capital Employed = Earnings Before Interest and Tax (EBIT) ÷ (Total Assets – Current Liabilities)
0.074 = US$1.0m ÷ (US$22m – US$8.0m) (Based on the trailing twelve months to May 2021).
The result is a ROCE of 7.4%, which is around its underlying industry (Aerospace & Defense) average of 7.8%.
This is especially favorable since the Aerospace & Defense industry is considered to be capital-intensive.
This is because unlike other fundamentals such as return on equity (ROE), which only analyzes profitability related to a company’s shareholders’ equity, ROCE considers debt and equity.
Ultimately, ROCE uncovers the amount of profit a company is generating per $1 of capital employed.
Byrna Technologies, Inc. (BYRN) is “flagging”
When we are looking for investments that we want to hold for the long-term, the combination of strong fundamentals and technicals is almost always the winning recipe.
When performing chart analysis for long-term investing ideas, it’s good practice to start by looking at the monthly chart.
Why?
Well, not only will you be able to see areas of support or resistance that date back to well before what is shown on the 3-to-12 month daily charts that so many of us use by default, but they usually reveal big patterns that often go unnoticed on charts with shorter timeframes.
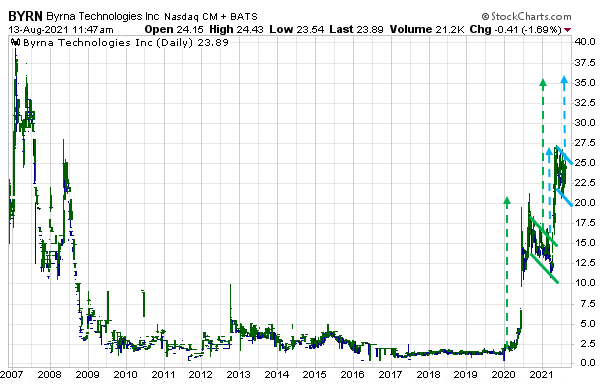
When we look at BYRN’s monthly chart, we see two “bull flags.”
If BYRN closes above $26 to confirm a break above the most recent “flag” that is still developing (see blue lines and arrows), it would produce a measured target that extends to right around the area of the larger “bull flag” that was confirmed earlier this year (see green lines and arrows) and has yet to reach its measured target.
That’s right! Both “flags” target the $36 area, which represents roughly another 60% upside potential from here.
Figure 1
How to position in BYRN for the long-term
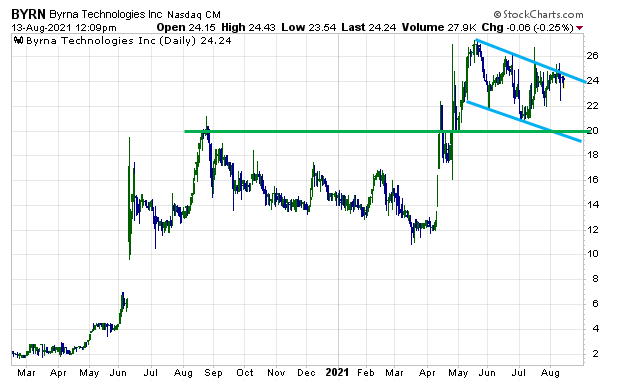
When we break the chart down to a smaller time frame in Figure 2 below, we can see that the stock is trying to rotate up and out of the recent “flag” consolidation phase.
Figure 2
When building a position in an investment that will be held for the long-term, the process does not have to be rushed.
What you want to do is identify a price area that is critical to the health of the prevailing trend you are trying to take advantage of.
As Figure 2 below shows, that area is the $20 to $22 area, which is where the early-July swing low, “flag” support, and bullish April breakout area have all joined forces to create a support platform (use this as your stop-out level) that, if breached, would signal a breakdown in this bullish trend setup.


1 Comments
SEEMS LIKE OTC ORDER AT $20 IS THE CALL HERE DOCTOR BOND :0