Chart patterns are everywhere.
But if you don’t know what to look for, or how to use them…not only will they not help you, they could hurt you.
Today I’m going to break down a flag pattern breakout in TSOI from my member’s watchlist last week.
But I’m not going to stop there…
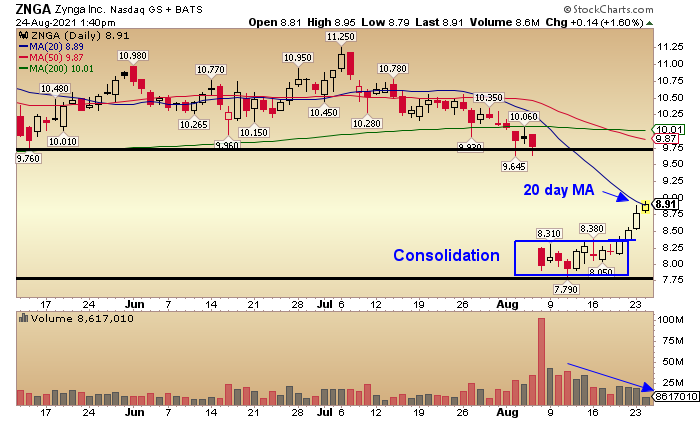
I’m also going to take a look at ZNGA’s after-earnings gap down, taking a dive into the consolidation breakout pattern and gap fill all in one chart.
Watchlist Flag Pattern Breakout in TSOI
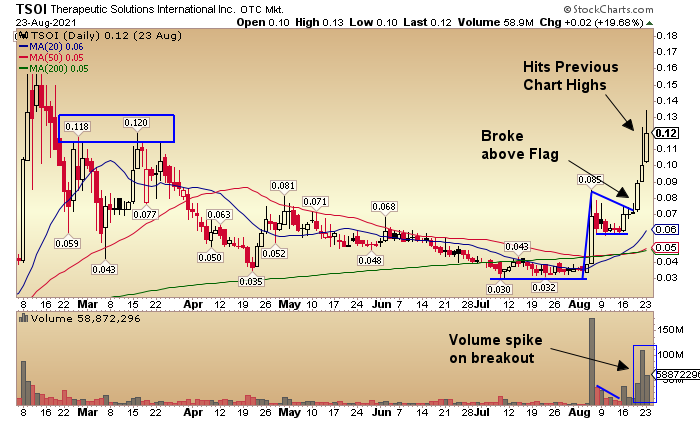
On Thursday I added TSOI to my watchlist with the break higher out of a flag pattern as seen in the chart below.
After trending down, the stock consolidated for the month before making a significant move, doubling in price on August 5.
That move created the flagpole, after which the price eased back down but held support at .06 creating the flag portion of the pattern.
This led to the setup that put the stock on my watchlist two days ago.
As you can see TSOI broke above the flag in a move higher last Thursday…and then Friday it continued up finding the resistance level between the previous chart highs of .11 and .12, marked in the blue square on the chart.
Putting it all together:
Notice the consolidation before the flagpole was formed. This gave the stock an accumulation period. A calm before the storm.
After a big spike in volume to form the flagpole, you’ll notice the volume trailed off while forming the flag portion. This is exactly what I want to see as the stock takes a breather.
And when the price breaks above the flag, I want to see volume increase (bottom of chart above) as a sign of confirmation for the move.
And lastly…I tend to look for resistance levels to target. In this case, the previous highs in the .11-.12 range which the stock hit within 2-3 days of the breakout.
Another way to find a target on a flag pattern breakout is to take the range of the flagpole and add it to the breakout point, which just so happens to put the target in the same area as the previous chart highs.
There really is something to important levels of support and resistance. The more I can line up the more I like a level.
Zynga Inc. (ZNGA)
Zynga (ZNGA) reported earnings after the market closed on August 5.
And while the company reported its best ever revenue for the second quarter and posted a profit vs. an expected loss, investors were more concerned about the CEO’s comments noting that people were playing games less frequently as economies opened back up, lowering expectations for next quarter.
And on that note, the stock gapped down into the upper 7’s, prices not seen since last year. But with positive free cash flow and a low price-to-sales ratio compared to its peers, the stock found support there.
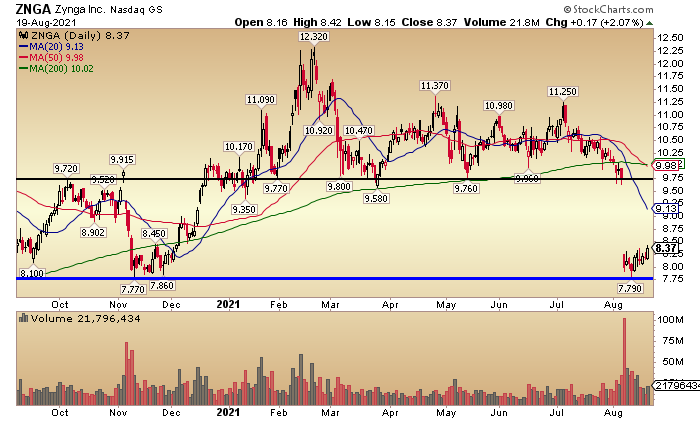
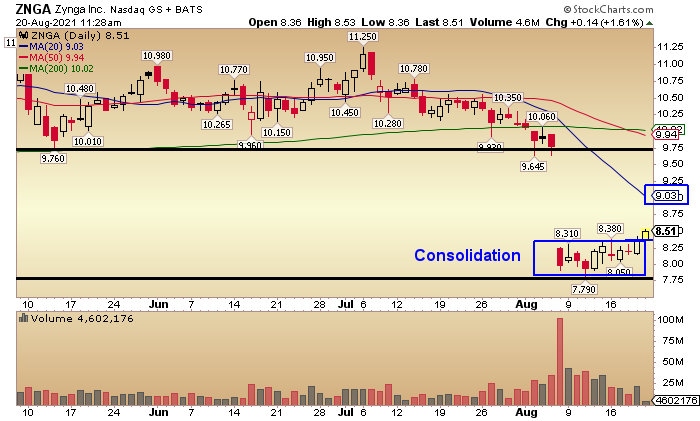
Traders took notice of the price level and the stock consolidated in a range between 7.80 and 8.40 before breaking above that range last Friday.
Trading into the gap, ZNGA had room to the 20 day MA which was at 9.03 at the time, and the upper end of the gap near 9.75.
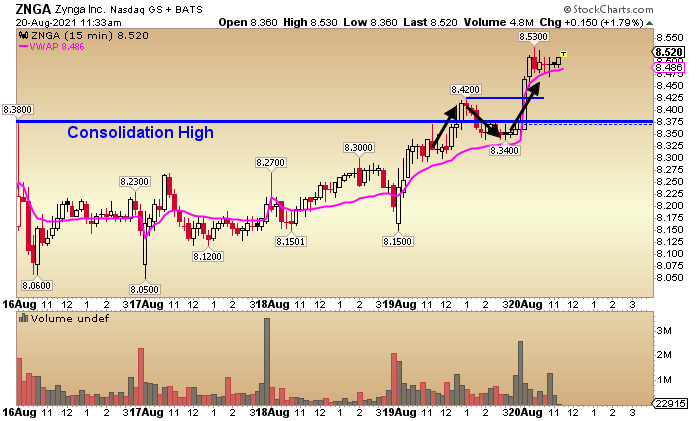
Looking at the 5-minute intraday chart from last Friday (below), the stock was making a higher high and higher low as it broke above the consolidation range Friday morning.
I always look to line up as many things as possible when looking at potential trades.
In this case, a stair step pattern with the price above the VWAP (pink line) on the intraday chart, along with a break above the consolidation range on the daily chart while also breaking into the gap.
Since breaking out of the consolidation range last Friday, ZNGA traded up until hitting the 20-day MA yesterday.
One thing to note here is the volume.
I like to see low volume in a consolidation range with a spike on the breakout.
In this case, you can see that volume trails off but never fully dies before breaking out…and doesn’t pick up much on the breakout.
As of right now, volume isn’t giving me the conviction piece I look for in a potential gap-fill.
Without an increase in volume, after the move up to the 20-day the stock is now in a “wait and see” price range for me.




2 Comments
Great explanation.
Thanks Jeff for Sharing your knowledge !! I still Learning from your Trading set up.